Reduced Local BOLD Correlation in Pre-Frontal Cortex during Deep Sleep
120 likes | 254 Vues
This study investigates the alterations in local BOLD signal correlations within the prefrontal cortex during deep sleep. It reveals a significant reduction in local BOLD correlations between the prefrontal and other default mode network (DMN) components. The analysis of regional homogeneity (ReHo) indicates that distinct spatial patterns characterize sleep-related changes, suggesting diminished cognitive functions in the frontal cortex during deep sleep. Results highlight the brain’s altered cognitive states, offering new insights into neural dynamics in sleep.

Reduced Local BOLD Correlation in Pre-Frontal Cortex during Deep Sleep
E N D
Presentation Transcript
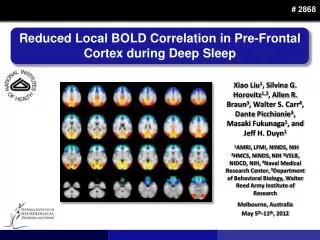
# 2868 Reduced Local BOLD Correlation in Pre-Frontal Cortex during Deep Sleep Xiao Liu1, Silvina G. Horovitz1,2, Allen R. Braun3, Walter S. Carr4, Dante Picchionie5, Masaki Fukunaga1, and Jeff H. Duyn1 1AMRI, LFMI, NINDS, NIH 2HMCS, NINDS, NIH 3VSLB, NIDCD, NIH, 4Naval Medical Research Center, 5Department of Behavioral Biology, Walter Reed Army Institute of Research Melbourne, Australia May 5th-11th, 2012
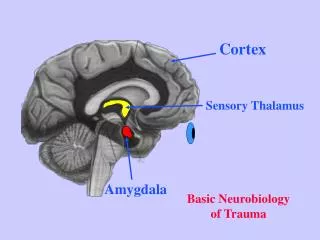
Decoupled Prefrontal DMN Component During Deep Sleep • Prefrontal part of default mode network (DMN) reduces its BOLD correlations with other DMN components during deep sleep. Further question: other than the long-range BOLD correlation, does the local BOLD correlations also change during deep sleep? Background Methods Results Discussions Horovitz, S.G., PNAS, 2009
Reanalyzing Previous Dataset Reprocessing Notes • Reprocess dataset published previously (Horovitz, S.G., PNAS, 2009) • Only include 7 subjects with separate wake data acquisition • Divide data into 300-sec segments • Carefully avoid periods with serious head motion • Separate pure Stage 2 from those mixed with Stage 3~4 sleep BackgroundMethodsResults Discussions • Regress out global signal and physiological noise • Align to Harvard-Oxford-Atlas Subcortical Cortical ROI # 55 1 48
Local BOLD Correlation: Regional Homogeneity (ReHo*) Averaged pairwise BOLD correlations within a 3x3x3-voxel cube ReHo Map Using atlas ROIs BackgroundMethodsResults Discussions Wake Deep Sleep Log (p-value) Statistical Inference for each ROI An Example of ROIs: Posterior Cingulate Cortex PCC Example ROI # * Zhang, Y., NeuroImage, 2004
ROI Analysis Result ReHo BackgroundMethodsResultsDiscussions 0.8 0.6 0.4 0.2 p-value< 0.05* < 0.01 ** <0.001 *** Wake Deep Sleep Increased Local correlation Decreased Local correlation
ROI Analysis Result • ROIs showing significant ReHo modulation during deep sleep BackgroundMethodsResultsDiscussions p-value (Bonf. Corrected) 10-10 10-10 Anterior and posterior brain show opposite modulation ! Wake > Deep Sleep Wake < Deep Sleep 10-3 10-3
Group ReHo Map Deep Sleep (n=58) Wake (n=27) BackgroundMethodsResultsDiscussions -0.2 0 0 1 1 0.2 Deep Sleep − Wake Deep Sleep − Wake p (Bonf. Corrected) 10-10 10-10 < Wake > Wake 0.05 0.05
Group ReHo Map Deep Sleep (n=58) Wake (n=27) Amplitude of fMRI BOLD fluctuation Local fMRI BOLD correlation change BackgroundMethodsResultsDiscussions -0.2 0 0 0.2 1 1 ? Deep Sleep − Wake Deep Sleep − Wake p (Uncorrected) 10-10 10-10 < Wake > Wake 10-3 10-3
Group Map of BOLD Fluctuation Amplitude (Standard Deviation) Deep Sleep (n=58) Wake (n=27) BackgroundMethodsResultsDiscussions -1% 0% 0% 2% 2% 1% Deep Sleep − Wake Deep Sleep − Wake p (Bonf. Corrected) 10-10 10-10 < Wake > Wake 0.05 0.05
Group Map of BOLD Fluctuation Amplitude (Standard Deviation) Deep Sleep (n=58) Wake (n=27) No correspondent modulation in BOLD fluctuation amplitude BackgroundMethodsResultsDiscussions -1% 0% 0% 1% 2% 2% Deep Sleep − Wake Deep Sleep − Wake p (Uncorrected) 10-10 10-10 < Wake > Wake 10-3 10-3
Discussion • During deep sleep, local fMRI signal correlations alter in a distinct, spatially consistent manner, with prefrontal regions showing a decrease and posterior regions showing an increase. • This observation is consistent with the notion that higher level cognitive function, commonly associated with frontal cortex, is reduced during sleep. BackgroundMethodsResultsDiscussions • Analysis of local correlations patterns may provide information about the brain’s cognitive state that is supplemental to information derived from long-range correlation analysis
Acknowledgements Dr. Thomas J. Balkin, NINDS, WRAIR, and NIDCD References BackgroundMethodsResults Discussions [1] Biswal, B. et al. MRM 1995 [2] Horovitz, SG. et al. PNAS 2009 [3] Spoormaker, VI. et al. J. Neurosci. 2010. [4] Boly, M. et al. Ann N Y Acad Sci. 2008. [5] Vincent, JL. et al. Nature. 2007. [6] Desikan, RS. et al. NeuroImage. 2006. Thank you!