Statistical Reasoning in Psychology: Inferential Statistics and Sampling Techniques
220 likes | 264 Vues
Learn how to use inferential statistics to generalize findings, test hypotheses, estimate population parameters, and make sample data manageable. Explore sampling methods and various estimation techniques in psychology.

Statistical Reasoning in Psychology: Inferential Statistics and Sampling Techniques
E N D
Presentation Transcript
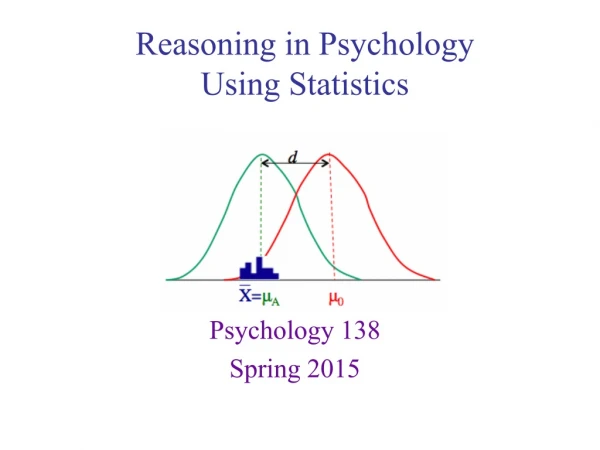
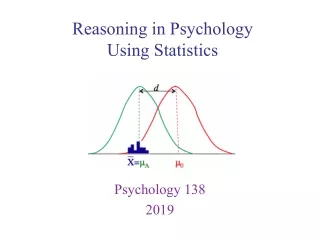
Reasoning in PsychologyUsing Statistics Psychology 138 2019
Quiz 9, due on Friday • Lab exam 4 one week from today • Final projects due May 3 (uploaded to ReggieNet) • On-line course evaluations • Look for an email (from Monday morning) with a link to take the on-line course evaluations. Please take 10 mins. or so to provide feedback. Annoucements
Inferential statistics used to generalize back Population • Hypothesis testing • Testing claims about populations (and the effect of variables) based on data collected from samples • Estimation • Using sample statistics to estimate the population parameters Sampling to make data collection manageable Sample Inferential statistics
Center/point estimate Standard error (difference expected due to chance) Test statistic with level of confidence Design Estimation (Estimated) Standard error One sample, σ known Estimation from last time
Design Estimation (Estimated) Standard error One sample, σ known One sample, σ unknown Two related samples, σ unknown Things to note: • The design drives the formula used • The standard error differs depending on the design (kind of comparison) • Sample size plays a role in SE formula and in df’s of the critical value • Level of confidence comes in with the critical value used Two independent samples, σ unknown Estimation Summary
Center/point estimate? How do we find this? How do we find this? • Two kinds of estimates that use the same basic procedure Computing the point estimate orthe confidence interval: • Step 1: Take your “reasonable” estimate for your test statistic • Step 2: Put it into the formula • Step 3: Solve for the unknown population parameter Depends on the design (what is being estimated) Use the t-table & your confidence level Depends on the design Estimation in other designs
2.5%+2.5% = 5% or α = 0.05, so look here so two tails with 2.5% in each 2.5% 2.5% 95% in middle 95% Confidence intervals always involve + a margin of error This is similar to a two-tailed test, so in the t-table, always use the “proportion in two tails” heading, and select the α-level corresponding to (1 - Confidence level) What is the tcrit needed for a 95% confidence interval? Estimates with t-scores
Confidence interval Diff. Expected by chance Estimating the difference between the population mean and the sample mean based when the population standard deviation is not known Estimation in one sample-t
Make an interval estimate with 95% confidence of the population mean given a sample with a X = 85, n = 25, and a sample s = 5. 2.5% 2.5% 95% What two critical t-scores do 95% of the data lie between? So the confidence interval is: 82.94 to 87.06 From the table: tcrit =+2.064 or 85 ± 2.064 -2.06 2.06 Estimation in one sample t-design
Estimating the difference between two population means based on two related samples Confidence interval Diff. Expected by chance Estimation in related samples design
Dr. S. Beach reported on the effectiveness of cognitive-behavioral therapy as a treatment for anorexia. He examined 12 patients, weighing each of them before and after the treatment. Estimate the average population weight gain for those undergoing the treatment with 90% confidence. Differences (post treatment - pre treatment weights): 10, 6, 3, 23, 18, 17, 0, 4, 21, 10, -2, 10 Related samples estimation Confidence level 90% CI(90%)= 5.72 to 14.28 Estimation in related samples design
Estimating the difference between two population means based on two independent samples Confidence interval Diff. Expected by chance Estimation in independent samples design
Dr. Mnemonic develops a new treatment for patients with a memory disorder. He randomly assigns 8 patients to one of two samples. He then gives one sample (A) the new treatment but not the other (B) and then tests both groups with a memory test. Estimate the population difference between the two groups with 95% confidence. Independent samples t-test situation Confidence level 95% CI(95%)= -8.73to 19.73 Estimation in independent samples design
Design Estimation (Estimated) Standard error One sample, σ known One sample, σ unknown Two related samples, σ unknown Things to note: • The design drives the formula used • The standard error differs depending on the design (kind of comparison) • Sample size plays a role in SE formula and in df’s of the critical value • Level of confidence comes in with the critical value used Two independent samples, σ unknown Estimation Summary
-8.73 19.73 • If we had instead done a hypothesis test with an α = 0.05, what would you expect our conclusion to be? • Dr. Mnemonic develops a new treatment for patients with a memory disorder. He randomly assigns 8 patients to one of two samples. He then gives one sample (A) the new treatment but not the other (B) and then tests both groups with a memory test. Estimate the population difference between the two groups with 95% confidence. - Fail to reject the H0 Independent samples t-test situation Confidence level 95% 0 • Notice that this interval includes zero • So the estimate of the population mean difference includes the possibility of zero (“no difference”) CI(95%)= -8.73to 19.73 Estimation in independent samples design
Two types typically • Standard Error (SE) • diff by chance • Confidence Intervals (CI) • A range of plausible estimates of the population mean CI: μ = (X) ± (tcrit) (diff by chance) Note: Make sure that you label your graphs, let the reader know what your error bars are Error bars
Important point! • In text (APA style) example M = 30.5 cm, 95% CI [18.0, 42.0] • In graphs as error bars • In tables (see more examples in APA manual) Error Bars: Reporting CIs
Some argue that CIs are more informative than p-values Hypothesis testing & p-values • Dichotomous thinking • Yes/No reject H0 (remember H0 is “no effect”) Neyman-Pearson approach • Strength of evidence Fisher approach Confidence Intervals • Gives plausible estimates of the pop parameter (values outside are implausible) • Provide information about both level and variability • Wide intervals can indicate low power • Good for emphasizing comparisons across studies (e.g., meta-analytic thinking) • Can also be used for Yes/No reject H0 Estimation: Why? Cummings (2012) website Cummings’ introduction to Estimation
Practice computing and interpreting confidence intervals • Understanding CI: https://www.youtube.com/watch?v=tFWsuO9f74o • Calculating CI: https://www.youtube.com/watch?v=s4SRdaTycaw • Kahn Academy: • CI and sample size: https://www.youtube.com/watch?v=K4KDLWENXm0 • CI and t-test: https://www.youtube.com/watch?v=hV4pdjHCKuA • CI for Ind Samp: https://www.youtube.com/watch?v=hxZ6uooEJOk (pt 2) • CI and margin of error: https://www.youtube.com/watch?v=UogOJHgJDqs • HT and CI: https://www.youtube.com/watch?v=k1at8VukIbw • HT vs. CI rap: https://www.youtube.com/watch?v=C88fUKAHPn0 • CIs by Geoff Cumming: • Introduction to: https://www.youtube.com/watch?v=OK6DXfXv8BM • Workshop (6 part series) In labs
-1.4 5.9 MD = 2.23, 95% CI [-1.4, 5.9] • If we had instead done a hypothesis test on 2 independent samples with an α = 0.05, what would you expect our conclusion to be? H0: “there is no difference between the groups” MD = 2.23, t(34) = 1.25, p = 0.22 - Fail to reject the H0 0 Hypothesis testing with CIs
-1.4 5.9 0.6 6.6 MD = 2.23, 95% CI [-1.4, 5.9] • If we had instead done a hypothesis test on 2 independent samples with an α = 0.05, what would you expect our conclusion to be? H0: “there is no difference between the groups” MD = 2.23, t(34) = 1.25, p = 0.22 • - Fail to reject the H0 0 MD = 3.61, 95% CI [0.6, 6.6] - reject the H0 MD = 3.61, t(42) = 2.43, p = 0.02 Hypothesis testing with CIs
Error bars can be informative about group differences, but you have to know what to look for Rule of thumb for 95% CIs*: • If the overlap is about half of one one-sided error bar, the difference is significant at ~ p < .05 • If the error bars just abut, the difference is significant at ~ p< .01 *works if n > 10 and error bars don’t differ by more than a factor of 2 Cumming & Finch, 2005 Group Differences: 95%CI Rule of Thumb Error Bars: Reporting CIs