Download

1 / 36
360 likes | 390 Vues
Learn about causal claims in psychology, using statistics for reasoning and analysis. Understand correlation vs. causation, descriptive statistics, and how to interpret data effectively.

E N D
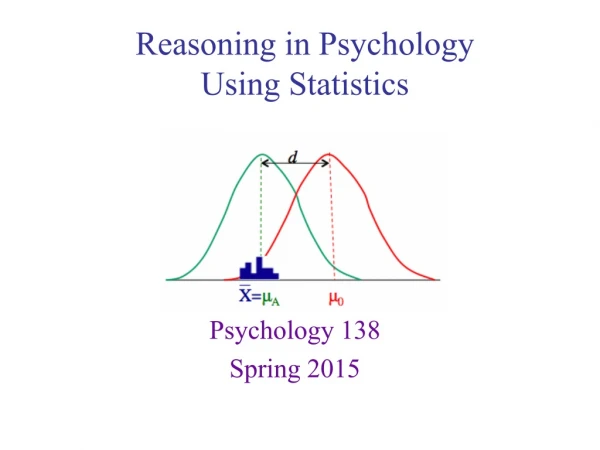
Reasoning in PsychologyUsing Statistics Psychology 138 2018
Exam 2 in lecture and lab on Wednesday • Be prepared to do calculations (including square roots) on calculator Announcements
We’d like to say: • X causes Y • To be able to do this: • The causal variable must come first • There must be co-variation between the two variables • Need to eliminate plausible alternative explanations Causal claims
- Or sleeping well makes you happy? • We’d like to say: • X causes Y • To be able to do this: • The causal variable must come first • There must be co-variation between the two variables • Need to eliminate plausible alternative explanations • Directionality Problem (temporal precedence): • Happy people sleep well Causal claims
We’d like to say: • X causes Y • To be able to do this: • The causal variable must come first • There must be co-variation between the two variables • Need to eliminate plausible alternative explanations • Third Variable Problem: • - Happy people sleep well • - Or does sleeping well make you happy? • OR something elsemakes people happy and sleep well! • Regular exercise • Minimal use of drugs & alcohol • Being a conscientious person • Being a good relationship Other Variable Causal claims
Coincidence (random co-occurence) • r=0.52 correlation between the number of republicans in US senate and number of sunspots • From Fun with correlations • See also Spurious correlations • We’d like to say: • X causes Y • To be able to do this: • The causal variable must come first • There must be co-variation between the two variables • Need to eliminate plausible alternative explanations Causal claims Correlation is not causation blog posts: Internet’s favorite phrase Why we keep saying it
Descriptive Statistics - Statistical procedures to help organize, summarize & simplify large sets of data • One variable (frequency distribution) • Display results in a frequency distribution table & histogram (or bar chart if categorical variable). • Make a deviations table to get measures of central tendency (mode, median, mean) & variability (range, standard deviation, variance). • Two variables (bivariate distribution) • Display results: Make a scatterplot. • Make a bivariate deviations or z-table table to get Pearson’s r. • Z-scores & normal distribution Review for Exam 2: Descriptive statistics
Are hours sleeping related to GPA? • You conduct a survey. • Your sample of 10 gives these results for average hours per night sleeping: 7, 6, 7, 8, 8, 7, 9, 5, 9, 6 • You also have respondents give their overall GPA: 2.4, 3.9, 3.5, 2.8, 3.0, 2.1, 3.9, 2.9, 3.6, 2.7 • We will focus on sleep results first and then both variables together. • What kind of scales are they? • To find standard deviation, will we use formula for population or sample? Example
Hrs. sleep n=10 7,6,7,8,8 7,9,5,9,6 ∑ 10 1.0 100 Step 1: Frequency distribution & histogram
Hrs. sleep n=10 7,6,7,8,8 7,9,5,9,6 ∑ 10 1.0 100 Will enter first two columns as X and Y axes for frequency distribution Step 1: Frequency distribution & histogram
Hrs. sleep n=10 p = f/n ∑ 10 1.0 100 Step 1: Frequency distribution & histogram
∑ 10 1.0 100 Step 1: Frequency distribution & histogram
∑ 10 1.0 100 Step 1: Frequency distribution & histogram
∑ 10 1.0 100 Step 1: Frequency distribution & histogram
∑ 10 1.0 100 Step 1: Frequency distribution & histogram
∑ 10 1.0 100 Step 1: Frequency distribution & histogram
Hrs. sleep F R E Q U E N C Y SCORE Step 1: Frequency distribution & histogram
Suppose that you combine two groups together. • How do you compute the new group mean? Group 1 Group 2 New Group 140 110 110 110 140 110 110 140 110 110 A weighted mean
Suppose that you combine two groups together. • How do you compute the new group mean? Be careful computing the mean of this distribution, remember there are groups here Group 1 Group 2 New Group 9 9 8 8 7 7 7 6 6 5 140 110 110 110 140 110 110 140 110 110 A weighted mean
Hrs. sleep n = 10 X Create table, sorted in descending order Step 2: Deviations table
Hrs. sleep n = 10 X Mode = 7 (filled in) Median = 7 (arrow) Mean = (∑X)/n = 72/10 = 7.2 Range = 5 to 9 ∑ 72 Step 2: Deviations table
Hrs. sleep n = 10 X = 9-7.2 Mode = 7 Median = 7 Mean = (∑X)/n = 72/10 = 7.2 Range = 5 to 9 ∑ 72 7.2 0 Step 2: Deviations table
Hrs. sleep n = 10 X = 1.82 Mode = 7 Median = 7 Mean = ∑X/n = 72/10 = 7.2 Range = 5 to 9 SD for sample = √15.6/9 = √1.73 = 1.32 ∑ 72 7.2 0 15.6 = SS Step 2: Deviations table
The mean • Change/add/delete a given score, then the mean will change. • Add/subtract a constant to each score, then the mean will change by adding(subtracting) that constant. • Multiply (or divide) each score by a constant, then the mean will change by being multiplied by that constant. • The standard deviation • Change/add/delete a given score, then the mean will change. • Add/subtract a constant to each score, then the standard deviation will NOT change. • Multiply (or divide) each score by a constant, then the standard deviation will change by being multiplied by that constant. Characteristics of a mean & standard deviation
Person Hrs. GPA A 7 2.4 B 6 3.9 C 7 3.5 D 8 2.8 E 8 3.0 F 7 2.1 G 9 3.9 H 5 2.9 I 9 3.6 J 6 2.7 GPA Hours of sleep Step 3: Scatterplot
Person Hrs. GPA A 7 2.4 B 6 3.9 C 7 3.5 D 8 2.8 E 8 3.0 F 7 2.1 G 9 3.9 H 5 2.9 I 9 3.6 J 6 2.7 GPA What does shape of envelope indicate about correlation? low positive correlation Hours of sleep Step 3: Scatterplot
Person Hrs. GPA A 7 2.4 B 6 3.9 C 7 3.5 D 8 2.8 E 8 3.0 F 7 2.1 G 9 3.9 H 5 2.9 I 9 3.6 J 6 2.7 K 5 1.0 GPA What does shape of envelope indicate about correlation? moderate positive correlation Hours of sleep Step 3: Scatterplot, Effect of outlier
Person Hrs. GPA A 7 2.4 B 6 3.9 C 7 3.5 D 8 2.8 E 8 3.0 F 7 2.1 G 9 3.9 H 5 2.9 I 9 3.6 J 6 2.7 K 9 1.0 GPA What does shape of envelope indicate about correlation? low negative correlation Hours of sleep Step 3: Scatterplot, Effect of outlier
n=10 Note signs! Sum Mean +r or – r? Step 4: Bivariate Deviations Table
Pearson’s r & summary statistics XY co-deviations ___2.24___ √ 15.6 * 3.47 = _2.24_ √54.132 = _2.24_ = .304 7.357 = X deviations, Y deviations
μ • Based on normative data: Normal, μ = 50.0, σ = 10.0 SRA (Scientific Reasoning Assessment) (fictional) • Preparing for your analyses • Write down what you know • Make a sketch of the distribution (make a note: population or sample) • Determine the shape • What is best measure of center? • What is best measure of variability? • Mark the mean (center) and standard deviation on your sketch 40 60 An example
0.0668 m SRA (Scientific Reasoning Assessment) (fictional) • Based on normative data: Normal distr., μ = 50.0, σ = 10.0 • Question 1 • If George got a 35 on the SRA, what is his percentile rank? Unit Normal Table • Since a normal distribution, can use Unit Normal Table to infer percentile. 40 60 1.0 -1.0 That’s 6.68% at or below this score (definition of percentile) z-scores & Normal Distribution
0.1587 0.1587 m SRA (Scientific Reasoning Assessment) (fictional) • Based on normative data: Normal distr., μ = 50.0, σ = 10.0 • Question 2 Unit Normal Table • What proportion of people get between a 40 and 60 on the SRA? 40 40 60 60 1.0 -1.0 That’s about 32% outside these two scores • Since a normal distribution, can use Unit Normal Table to infer percentile. That leaves 68% between these two scores z-scores & Normal Distribution
transformation SRA (Scientific Reasoning Assessment) (fictional) • Based on normative data: Normal distr., μ = 50.0, σ = 10.0 • Question 3a • Suppose that Chandra took a different reasoning assessment (the RSE: Based on normative data, Normal distr., μ= 100, σ = 15). She received a 130 on the RSE. Assuming that they are highly positively correlated, what is the equivalent score on the SRA? z-scores & Normal Distribution
transformation SRA(Scientific Reasoning Assessment) (fictional) • Based on normative data: Normal distr., μ = 50.0, σ = 10.0 • Question 3a (for RSE) • Suppose that Chandra took a different reasoning assessment (the RSE: Based on normative data, Normal distr., μ= 100, σ = 15). She received a 130 on the RSE. Assuming that they are highly positively correlated, what is the equivalent score on the SRA? (for SRA) z-scores & Normal Distribution
In lab: continue to review, including SPSS • Questions? Wrap up