Reasoning in Psychology Using Statistics
260 likes | 278 Vues
This quiz covers tables, graphs, measures of center, and measures of variability. Transforming scores into z-scores, normal distribution, and using unit normal table. It lays the foundation for upcoming exams and extra credit opportunities. Ensure to grasp the concepts now to build upon them effectively.

Reasoning in Psychology Using Statistics
E N D
Presentation Transcript
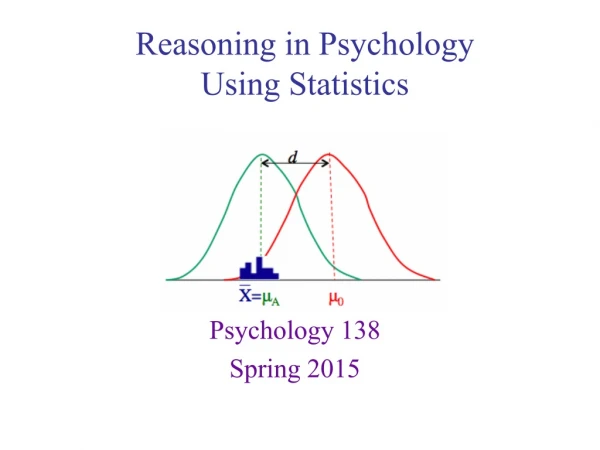
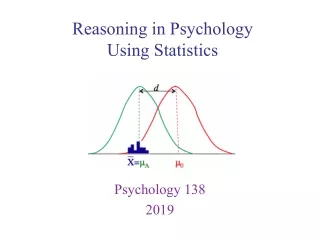
Reasoning in PsychologyUsing Statistics Psychology 138 2019
Quiz 3 is posted, due Friday, Feb. 22 at 11:59 pm • Covers • Tables and graphs • Measures of center • Measures of variability • You may want to have a calculator handy • Exam 2 is two weeks from today (Wed. Mar. 6th) • Don’t forget about Extra-Credit through SONA Annoucement
Transformations: z-scores • Normal Distribution • Using Unit Normal Table • Combines 2 topics Today • Statistical Snowball: • For the rest of the course, new concepts build upon old concepts • So if you feel like you don’t understand something now, ask now, don’t wait. X X X X Outline for next 2 classes
CVA Rotunda • North (and 10o West) • Approx. 1625 ft. 1625ft. • Where is Bone student center? • Reference point • Direction • Distance Location
Reference point • Direction • Distance μ • Where is a score within distribution? • Obvious choice is mean • Negative or positive sign ondeviation score Subtract mean from score (deviation score). • Value of deviation score Locating a score
Reference point Direction μ X1 - 100= +62 X1 = 162 X2 = 57 X2 - 100= -43 Locating a score
Below Above μ X1 - 100= +62 X1 = 162 Direction X2 = 57 X2 - 100= -43 Locating a score
Distance Distance μ X1 - 100= +62 X1 = 162 X2 = 57 X2 - 100= -43 Locating a score
Raw score Population mean Population standard deviation • Direction and Distance • Deviation score is valuable, • BUT measured in units of measurement of score • AND lacks information about average deviation • SO, convert raw score (X) to standard score (z). • This puts the deviation into a neutral unit of measurement: standard deviation units • Recall: standard deviation is the average distance scores deviate from the mean, so this puts things relative to that average deviation in the distribution Transforming a score
z-score: standardized location of X value within distribution X1 - 100= +1.24 50 X2 - 100= -0.86 μ 50 If X1 = 162, z = • Direction. Sign of z-score (+ or -): whether score is above or below mean • Distance. Value of z-score: distance from mean in standard deviation units If X2 = 57, z = Transforming scores
z-score: standardized location of X value within distribution X1 - 20= +1.2 5 X2 - 20= -0.8 μ 5 μ = 20 σ = 5 If X1 = 26, z = • Direction. Sign of z-score (+ or -): whether score is above or below mean • Distance. Value of z-score: distance from mean in standard deviation units If X2 = 16, z = Transforming scores
Can transform all of scores in distribution • Called a standardized distribution • Has known properties (e.g., mean & stdev) • Used to make dissimilar distributions comparable • Comparing your height and weight • Combining GPA and GRE scores • This particular standardize distribution: z-distribution • One of most common standardized distributions • Can transform all observations to z-scores if we know distribution mean & standard deviation (can do the same thing for populations and samples) Transforming distributions (transforming all the scores)
Shape: • Mean: • Standard Deviation: Properties of z-score distribution
transformation 50 150 μZ μ • Shape: Same as original distribution of raw scores. Every score stays in same position relative to every other score. original z-score • Note: this is true for other shaped distributions too: • e.g., skewed, mulitmodal, etc. Properties of z-score distribution
transformation 50 150 μZ μ Xmean = 100 • Shape: Same as original distribution of raw scores. Every score stays in same position relative to every other score • Mean • If X = μ, z = ? • Meanz always = 0 = 0 = 0 Properties of z-score distribution
Shape: Same as original distribution of raw scores. Every score stays in same position relative to every other score • Mean: always = 0 • Standard Deviation: Properties of z-score distribution
transformation +1 μ μ X+1std = 150 • Shape: Same as original distribution of raw scores. Every score stays in same position relative to every other score • Mean: always = 0 • Standard Deviation: For z, 50 150 = +1 z is in standard deviation units Properties of z-score distribution
transformation -1 μ μ X-1std = 50 • Shape: Same as original distribution of raw scores. Every score stays in same position relative to every other score • Mean: always = 0 • Standard Deviation: For z, 50 150 +1 = +1 X+1std = 150 = -1 Properties of z-score distribution
Shape: Same as original distribution of raw scores. Every score stays in same position relative to every other score • Mean: always = 0 • Standard Deviation: always = 1, so it defines units of z-score Properties of z-score distribution
μ μ transformation 50 150 -1 +1 z = -0.60 • Can go both directions: If knownz-score,mean & standard deviation of original distribution, can find raw score (X) • have 3 values, solve for 1 unknown (z)( σ) = (X - μ) X = (z)( σ) + μ X = 70 X = (-0.60)( 50) + 100 = -30 +100 From z to raw score:
Example 1 A student got 580 on the SAT. What is her z-score? Another student got 420. What is her z-score? • Population parameters of SAT: μ= 500, σ= 100 SAT examples
Student said she got 1.5 SD above mean on SAT. What is her raw score? • Population parameters of SAT: μ= 500, σ= 100 Example 2 X = z σ + μ = 150 + 500 = 650 = (1.5)(100) + 500 • Standardized tests often convert scores to: μ = 500, σ = 100 (SAT, GRE) μ = 50, σ = 10 (Big 5 personality traits) SAT examples
Example 3 Suppose you got 630 on SAT & 26 on ACT. Which score should you report on your application? • SAT: μ = 500, σ = 100 • ACT: μ = 21, σ = 3 z-score of 1.67 (ACT) is higher than z-score of 1.3 (SAT), so report your ACT score. SAT examples
Example 4 On Aptitude test A, a student scores 58, which is .5 SD below the mean. What would his predicted score be on other aptitude tests (B & C) that are highly correlated with the first one? Test B: μ = 20, σ = 5 XB < or > 20? How much: 1? 2.5? 5? 10? Test C: μ = 100, σ = 20 XC < or > 100? How much: 20? 10? If XA = -.5 SD, then zA = -.5 XB = zBσ + μ XC = zCσ + μ = (-.5)(20) + 100 = -10 + 100 = 90 Find out later that this is true only if perfectly correlated; if less so, then XB and XC closer to mean. = (-.5)(5) + 20 = -2.5 + 20 = 17.5 Example with other tests
X X X X Formula Summary
In lab • Using SPSS to convert raw scores into z-scores; copy formulae with absolute reference • Questions? • Brandon Foltz: Understanding z-scores (~22 mins) • StatisticsFun (~4 mins) • Chris Thomas. How to use a z-table (~7 mins) • Dr. Grande. Z-scores in SPSS (~7 mins) Wrap up