Block Diagram
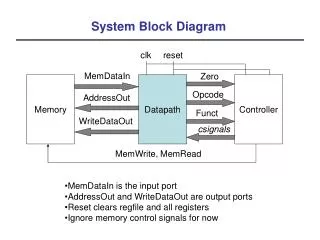
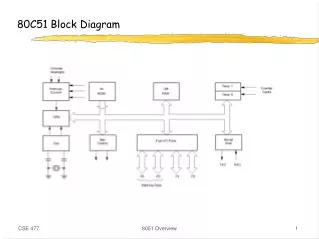
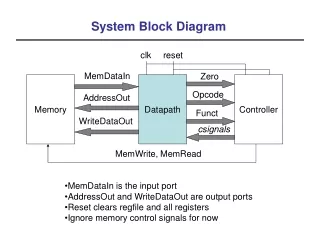
Block Diagram. CA Client (medm) Control SUB record and linked records. Reboot File. Database SUB record for each channel. Other records linked with SUB record. IOC. PC. LabVIEW Program #1. LabVIEW Program #2. Config File #1. Config File #2. PC. MTB Board #1. MTB Board #2.

Block Diagram
E N D
Presentation Transcript
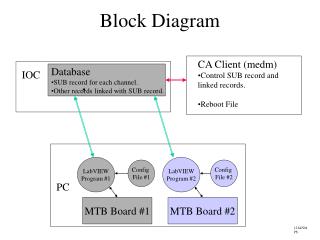
Block Diagram • CA Client (medm) • Control SUB record and linked records. • Reboot File • Database • SUB record for each channel. • Other records linked with SUB record. IOC PC LabVIEW Program #1 LabVIEW Program #2 Config File #1 Config File #2 PC MTB Board #1 MTB Board #2 12JAN04 PS
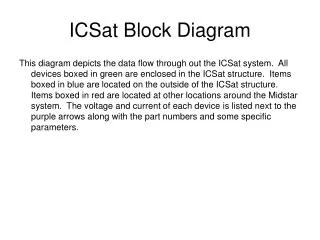
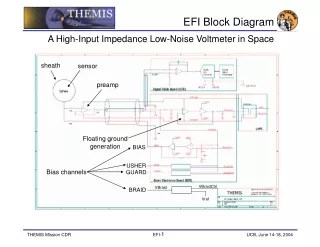
MTBeddtg Control Record Arrangement (optional AO record) select Delay Time B (optional AO record) select TG Gate Duration C 1=Enable (optionally use BO records) MBBO record to select Event Code Enable Facility Clock events INPA B0 B1 B2 B3 Read by LabVIEW MBBO Direct record to mux Trigger Inputs INPD Enable Trigger_A Enable Trigger_B MBBO record to select Personality INPE VAL Enable Retrigger Composite Control Word 5 sec Load MTB Channel INPF 1=LOAD Channel Now Rising-edge sensitive command Enable/Disable a channel INPG 1=Enable 1=Arm Arm module INPH SUB Record using ce_MTBeddtg subroutine 5 sec MBBO record to select Self Test Event Code. INPI Send Self-Test Event INPJ 12JAN04 PS 1=Issue Code Now Rising-edge sensitive command
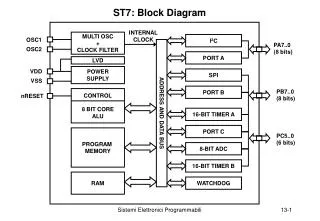
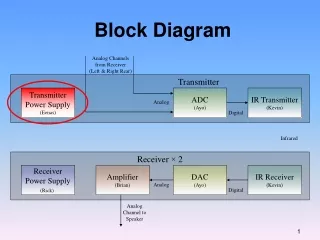
MTBstatus Record Arrangement (optionally use BI records) Channel Enabled B0 B1 B2 B3 B4 B5 B6 B7 B8 B9 Status Word #1 from LabVIEW MBBI Direct record to demux Status bits INPA EDD Delay Active TG Gate Active MBBI record to show Event Code INPB E Facility Clock Events Enabled Status Word #2 from LabVIEW Channel Personality F Trig_A Enabled Board number G Trig_B Enabled Channel number H Channel Retrigger mode. I Number of MTB boards in PC J Watchdog Counter Module Armed K Last Event Code Received SUB Record using ce_MTBstatus subroutine Facility Clock Health VAL Program Operation Status Interface Board Connection Monitored Delay Time from LabVIEW (optional AI record) C show Delay Time (optional AI record) Monitored Gate Duration from LabVIEW show TG Gate Duration D 12JAN04 PS