Sensor Applications and Data Validation
Sensor Applications and Data Validation. Presented at Alabama A & M University. John Wiley Marshall Space Flight Center Advanced Sensors Development and Testing. Sensor and Transportation Timeline. Timeline of Sensor and Transportation History. 1800. 1700.

Sensor Applications and Data Validation
E N D
Presentation Transcript
Sensor Applications and Data Validation Presented at Alabama A & M University John Wiley Marshall Space Flight Center Advanced Sensors Development and Testing Sensor Applications and Data Validation
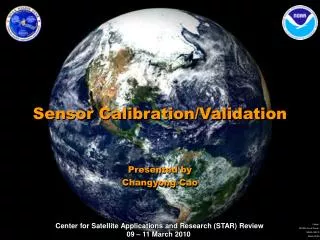
Sensor and Transportation Timeline Sensor Applications and Data Validation
Timeline of Sensor and Transportation History 1800 1700 In 1622 the invention of the slide rule along with fundamental physical sensors (thermometer and Pitot tube) led the way for the earliest mechanically fuel propulsion system – steam locomotion. Sensor Applications and Data Validation
Timeline of Sensor and Transportation History 1800 1700 The first electric motor in 1821 came in use along with the Venturi tube. This year also marked the invention of the thermocouple still in common use today! Sensor Applications and Data Validation
Timeline of Sensor and Transportation History 1900 1840 Sensor engineering was revolutionized with the invention of the magnetic flow meter and the Wheatstone bridge. A few decades later the first gasoline powered automobile hit the streets. Sensor Applications and Data Validation
Timeline of Sensor and Transportation History 1900 1840 Man’s first powered flight followed on the heels of the earliest magnetic recordings, the resistance thermal device (RTD) and the optical pyrometer. Still a century to go! Sensor Applications and Data Validation
Timeline of Sensor and Transportation History No significant sensor development 1925 1940 With electronic amplifying tubes and the 1908 development of the strain gauge Man’s first steps are taken toward space with the first liquid fueled rocket. Sadly, this also begins a void in fundamental sensors innovation. Sensor Applications and Data Validation
Timeline of Sensor and Transportation History No significant sensor development 1925 1940 In 1930 computer solutions to differential equations were available. Existing sensors helped engineer and test larger chemical rockets. Sensor Applications and Data Validation
Timeline of Sensor and Transportation History No significant sensor development 1960 The1947 supersonic flight followed the creation of the ENIAC. Data systems and supporting electronics continue to advance. Still no significant sensor development! Sensor Applications and Data Validation
Timeline of Sensor and Transportation History No significant sensor development 1960 Enter in the age of the transistor. Electronics are revolutionized. Mankind challenges the Moon. Again, no sensor advancement Sensor Applications and Data Validation
Timeline of Sensor and Transportation History No significant sensor development 1980 2000 Man’s first powered flight followed on the heels of the earliest magnetic recordings, calculators and optical pyrometer. There is still a century to go! Sensor Applications and Data Validation
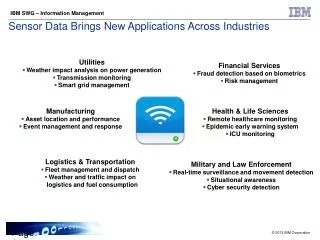
Sensor Enabled Technology Advancements The mechanical configuration of automobiles have changed marginally while improvements in sensors and control have dramatically improved engine efficiency, reliability and useful life. The aviation industry has also taken advantage of sensors and control systems to reduce operational costs. Sensors and high fidelity control systems fly planes at levels of performance beyond human capability. Sophisticated environmental controls allow a greater level of comfort and efficiency in our homes. Sensors have given the medical field a better understanding of the human body and the environment in which we live. Sensor Applications and Data Validation
Sensor Applications Sensor applications are the process of selecting the correct sensor for the desired measurement. Define a well thought out measurement problem. Define how the data will be used. Have an open mind regarding the best solution to the measurements problem. Don’t get trapped by “catalog engineering”. Identify all of the desired parameters to be measured. Identify all of the environmental parameters that will affect the measurement. Determine a validation plan. Determine calibration requirements Write a statement and assessment of necessary technical assumptions Write a statement and assessment of the risks to the data. Sensor Applications and Data Validation 13 Alabama A&M University July 2008
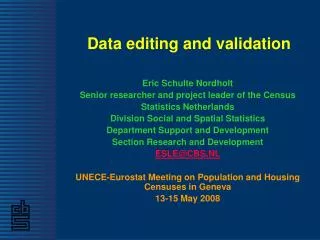
Data Validation “Valid Data are data that represent the process being observed as though the Measurement System had not been there, interfering with the process being observed and distorting the information flow through the system.” Peter K. Stein Validation is the process of analyzing the complete measurement system for undesired sensitivities or insensitivities that will distort data. Sensor Applications and Data Validation 14 Alabama A&M University July 2008
Sensor Applications Sensor Applications and Data Validation
Sensor Applications • Sensor and Transportation Timeline • Sensor Applications • What is a Measurement ? • Measurement Tenets • The Complete Measurement System • Measurand • Boundary Layers • Sensor Sensitivities • Sensor Response Sensor Applications and Data Validation
Sensors Measure Physical Parameters Pressure Temperature Flow Acceleration Heat Flux Optical Intensity Etc, Sensor Applications and Data Validation
What is a Measurement ? A measurement is the process of converting energy from some physical phenomena into a form that can be analytically manipulated into engineering units in order to obtain information about the phenomena under consideration. Information Transfer Requires Energy Transfer ! Sensor Applications and Data Validation
Measurement Tenets • What do you really need to measure? • How are you going to use the measured information? • Recognize that each boundary layer or component between you and the fundamental measurand affects delay, response, repeatability, linearity and hysteresis. • Do not change what you are attempting to measure by making the measurement! • “What would the measurement system have read if it had not been there transferringenergy with the physical phenomena you are measuring?” • Peter K. Stein Sensor Applications and Data Validation
The Complete Measurement System Digital Data Acquisition (DAQ) Filtering Temporal Response Frequency Response Boundary Layers Equations Lookup Tables • Electronic • Signal Conditioning • Frequency to DC • Amplification • Bridge conditioning • Temp reference Undesired Physical Phenomena Power Output • Sensors/Transducers • Pressure • Temperature • Optical Detector Human Data Analysis Boundary Layers Sense Lines Diaphragms Wires Input Measurand Desired Physical Phenomena Reference: 2 Sensor Applications and Data Validation
Basic Sensor Model Desired Sensor Sensitivities Sensor Output: Desired Inputs: Pressure Temperature Etc. Undesired Sensor Sensitivities Undesired Inputs: Temperature Strain Etc. Undesired Sensor sensitivities are physical phenomena that that causes your sensor or electronics to produce an output. !! Both Desired and Undesired inputs will produce an output if the sensor is sensitive to those inputs !! Sensor Applications and Data Validation
The Measurand -Desired Physical PhenomenaMass Flow Measurement Example The physical phenomena that you would like to measure. This is also your desired sensor sensitivity. Fluid Flow A=Πr2 x x Density (ρ) kg/m3 Velocity ( ) m/s Cross-Sectional Area ( A ) m2 Kg/s Sensor Applications and Data Validation
Analytic & Physical Boundary Layers Fluid Flow Restriction A=Πr2 Probe Probe Sense Line Tube Sense Line Tube Volumetric Flow LPM Temperature ºC Pressure KPa Temperature ºC Pressure KPa Kg/s Sensor Applications and Data Validation 23 Alabama A&M University July 2008
Sensor Response • Temporal Response • The time constant or rise time of the sensor. • Frequency Response • The “bandwidth” of frequencies that the sensor can respond to. • Phase Response • The associated delay of individual frequencies the sensor responds to. • Indicial Response • Sensor system response to a step function input. Sensor Applications and Data Validation
Temporal Response • Rise Time • The time it takes for a sensor to go from 10% to 90% of a step input. • 1st Time Constant (tau) • The time it takes for a sensor to go from 0 to 63.2% of a step input. It takes approximately 5 tau to reach 99.9% of a step input. Sensor Applications and Data Validation
Temporal Response Sensor Applications and Data Validation
Indicial Response Sensor Applications and Data Validation
Time Domain Deconvolution The systems indicial response can be separated from the phenomena you are measuring using time domain deconvolution. Sensor Applications and Data Validation
Sensor Frequency Response Where do you see frequency ? Sensor Applications and Data Validation 29 Alabama A&M University July 2008
Frequency Response (Butterworth) Sensor Applications and Data Validation
Frequency Response (Chebychev) Sensor Applications and Data Validation
Frequency Response (Elliptic) Sensor Applications and Data Validation
Boundary Layers • Physical Boundary Layers • Pressure sense line tubes • Material Thickness • Gradients; density, thermal, acoustic • Analytic Boundary Layers • Undesired sensor sensitivities • Complex equations • Calibrations Sensor Applications and Data Validation
Analytic Boundary C= discharge coefficient [unitless] Y1= adiabatic expansion factor [unitless] df= primary contraction diameter during actual flow conditions [m] Df= pipe diameter during actual flow conditions [m] = density at flowing conditions [kg/m3] ΔP= pressure differential [Pa] Sensor Applications and Data Validation
Analytic & Physical Boundary Layers, Insensitivities Fluid Flow Restriction A=Πr2 Probe Probe Sense Line Tube Sense Line Tube Volumetric Flow LPM Temperature ºC Pressure KPa Temperature ºC Pressure KPa Kg/s Sensor Applications and Data Validation 35 Alabama A&M University July 2008
Sensor Insensitivities Sometimes there are physical phenomena that goes undetected by your sensor that can cause error in your. All sensors are sensitive or insensitive to physical phenomena other than what you are trying to measure! Turbine flow meter Raw data Processed image Reference: 3 Sensor Applications and Data Validation
Sensor Insensitivities can result in invalid data Uncorrected density Optically corrected density Sensor Applications and Data Validation
Pressure Sense Lines Sensor Applications and Data Validation
Attenuation of pressure measurement Sensor Applications and Data Validation
Helmholtz Frequencies Tube length must be an odd integer number of quarter wavelengths, i.e., for n = 0,1,2… • Substituting l = v/f, we obtain for n = 0,1,2… Sensor Applications and Data Validation
Resonance Sensor Applications and Data Validation
Empirical Helmholtz Frequencies f (Hz) t (sec) Sensor Applications and Data Validation
Pressure Sense lines with thermal Gradients Sensor Applications and Data Validation
Thermal Gradients in Pressure Sense Lines Sensor Applications and Data Validation
Material Thickness Affects Temporal Response Sensor Applications and Data Validation 45 Alabama A&M University July 2008
Analytic & Physical Boundary Layers Data Fluid Flow Restriction A=Πr2 Probe Probe Sense Line Tube Sense Line Tube Volumetric Flow LPM Temperature ºC Pressure KPa Temperature ºC Pressure KPa Kg/s Sensor Applications and Data Validation 46 Alabama A&M University July 2008
Undesired Sensor Sensitivities – Mass Flow ExamplePressure, Temperature and Turbine Flow Meter Data LN2 Turbine Flow Meter Upstream LN2 Turbine Flow Meter Downstream Temperature at Optical Flow Meter Gaseous Helium Inlet Turbine Flow Meter Pressure at Optical Flow Meter Helium Injection ~2.5 Seconds Helium Injection ~3.5 Seconds Sensor Applications and Data Validation
Processed Optical Flow Meter Data Helium Injection ~3.5 Seconds Helium Injection ~2.5 Seconds Calculated Peng-Robinson Density Model Calculated Volume Fraction Density Optical Flow Meter Model Calculated Rayleigh Density Model Sensor Applications and Data Validation
Data Validation Sensor Applications and Data Validation
Data Validation • Data Validation • Validation versus calibration • System characterization • Data acquisition Sensor Applications and Data Validation