Download
1 / 29
290 likes | 318 Vues
Explore the analysis of the 2002 Woomera Explosives Experiment conducted for defense research, showcasing signal reception and detection using global minimization techniques. Discover the international collaboration in this scientific endeavor.

E N D
The Woomera Infrasound and Seismic Experiment David Brown1; Clive Collins1; Brian Kennett2 1. Geoscience Australia 2. Australian National University Geological Survey of Canada Australian Dept. of Defence 1
Introduction • The Woomera Experiment • An international explosives trial held at Woomera, South Australia, in September, October 2002 • Conducted for defence research by: • UK Ministry of Defence • Australian Department of Defence • Purpose: • ammunition stewardship program • Participation by: • Canada • Netherlands • Norway • USA • Singapore • Two explosions: • 27000 kg ammunition • 5000 kg ammunition • Portable network of sensors was deployed: • 2 three-sensor infrasound arrays • 18 seismometers IS07 2
Woomera Broken Hill Introduction Flinders Ranges 1165m 167m 900 m 315m 3
The Source Source Information 4
The Source Explosives Container Instruments, tamping Earthen walls 3 sides Concrete roof
The Source 27000 kg shot Shock wave Shock wave • Some statistics • for a block of rubble • T = 33.57 sec • = 508 m V = 165.2 m/s H = 1380.5 m q = 84.7 deg
The Source Norwegian house Australian house 7
Receiver Information Seismic Receiver Information Infrasound Receiver Information 8
Receiver Information Spectrogram: 20,000 lb Chemical Explosion @ 250 km 180 deg. backazimuth • Broad-band signal • signal duration: 0.6 min • dominant period 1.6 sec • drop-off frequency: • 6db down: > 2.0 Hz • 12 db down > 2.0 Hz • Fstat • @ max SNR: 4.3 • @Max Power: 21.5 • Frequency: • @max SNR 2.0 Hz • @max Power 0.47 Hz • Need to design a 3-sensor array with maximum capability around 0.5 Hz. ie, average intersensor spacing of around 330 m.
Receiver Information Broken Hill Station Finite-frequency array response 10
Receiver Information Broken Hill Station 11
Receiver Information Finite-frequency array response Oodnadatta Station 12
Receiver Information Oodnadatta Station 13
Receiver Information Finite-frequency array response IS07 Station 14
The Signals Broken Hill Station 27000 kg 16
The Signals Broken Hill Station 27000 kg 0.8 – 3.2 Hz 17
The Signals Broken Hill Station 27000 kg 342 m/s 289 deg 354 m/s 290 deg 348 m/s 290 deg 454 m/s 256 deg 477 m/s 257 deg 490 m/s 241 deg 18
The Signals IS07 27000 kg 352 m/s 167 deg 19
The Signals Oodnadatta Station 27000 kg 0.8 – 3.2 Hz 20
The Signals Broken Hill Station 5000 kg 0.4 – 1.6 Hz 21
GA Infrasonic Processing for CTBT monitoring raw data Knowledge of local sources Source Characterization study SH investigation Radionuclide investigation • Infrasonic Processing at Geoscience Australia • Will process 5 IMS stations: IS03, IS04, IS05, IS06, IS07 • Will observe the following processing philosophy Single station processing: Seeking significant signals on individual stations Automatic internal alert notification duration > 2 minutes Fstat > 10.0 SNR > 1.5 57 days 38185 detects 98 arrivals INFER Automatic detector DISCIN Simple discrimination criteria detection arrival Interactive Analysis review Interactive Analysis scanning DISCEX High-level discrimination procedures arrival 1 arrival Manual external alert notification 22
GA Infrasonic Processing for CTBT monitoring • Signal parameter estimation at sparse arrays • Global minimisation of the misfit between theoretical and stacked beam powers • theoretical side-lobe pattern will be imprinted on the stacked beam power Define broad-band theoretical array response to be Define broad-band stacked beam-power to be Define the misfit function using an norm as Use the Sambridge Neighbourhood Algorithm to converge to the region of best fit.
GA Infrasonic Processing for CTBT monitoring 3 -3 3 -3 Signal Reception and Detection: Sparse Arrays • Array response • Beam power as a function of slowness for I07AU array • Zero slowness • finite frequency signal centred at 0.875 Hz • 9 x 9 = 81 beams were used • maximum beam power centred on zero slowness Sy (s/km) Sx (s/km)
GA Infrasonic Processing for CTBT monitoring 3 -3 3 Sy -3 Sx (s/km) Signal Reception and Detection: Sparse Arrays Time (sec) N 2880 1440 2160 720 3600 0 Synthetic implant, azimuth, 128 deg. W E • Array response • Beam power as a function of slowness for I07AU array • with implanted signal • 9 x 9 = 81 beams were used • 0.875 Hz • maximum beam power centred on slowness • corresponding to the implant azimuth (128 deg) Slowness plane S
GA Infrasonic Processing for CTBT monitoring Signal Reception and Detection: Sparse Arrays misfit surface
GA Infrasonic Processing for CTBT monitoring Signal Reception and Detection: Sparse Arrays N N W E W minus E N S S 81 beams:1.5 deg accuracy in azimuth [BSSA, 2003, Vol 93 p.1765-1772] equals W E S
GA Infrasonic Processing for CTBT monitoring Network processing: Infrasonic source location • Determine the Great-circle intersection point • Determine the travel-times to receivers using a two-value constant velocity model : • 290 m/s (stratospheric propagation) • 240 m/s (thermospheric propagation) • Determine if predicted travel-times match observed arrival times for both stations (up to some variance) • Use uncertainty in measured azimuth to determine uncertainty in predicted source location INFRA_LOC_0 automatic 2 station source location detection origin INFRA_LOC_1 automatic source location (refinement level 1) origin > 2 stations Updated travel-time Information. GT information for testing Data Fusion INFRA_LOC_2 automatic source location (refinement level 2) origin 28
Summary • The Woomera Infrasound and Seismic experiment • Characterised by unusually fast travel-times • May be timing errors (unlikely) • Characterised by significant off-great circle azimuths • may be side-lobe detections (unlikely) • May be acoustic signal generated by the seismic interaction with the Flinders Ranges (?) • GA Infrasonic Processing • Seeks significant signals on individual stations first • Basic set of discrimination criteria for automatic alert notification • Duration, Coherence, Energy • Performs 2-station source location using constant velocity model • Will experiment with the Kennett procedure for sparse array processing • May help the spatial aliasing problem at sparse arrays 29
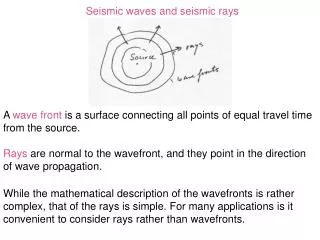


![[14] SEISMIC ANALYSIS OF THE NATIONAL COMPACT STELLERATOR Experiment (NCSX)](https://cdn1.slideserve.com/3216510/slide1-dt.jpg)