Download

1 / 15
170 likes | 375 Vues
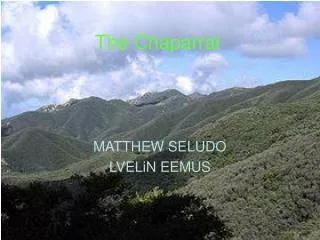
The Calibration and Modeling of Chaparral Infrasound Sensors. John V. Olson, Charles R. Wilson and Daniel Osborne Geophysical Institute, University of Alaska. Presented at the 2001 Infrasound Technology Workshop, Kailua-Kona, HI. Topics. The Chaparral microphones The UAF calibrator

E N D
The Calibration and Modelingof Chaparral Infrasound Sensors John V. Olson, Charles R. Wilson and Daniel Osborne Geophysical Institute, University of Alaska Presented at the 2001 Infrasound Technology Workshop, Kailua-Kona, HI
Topics • The Chaparral microphones • The UAF calibrator • Results of calibrations for low gain • Model equations for Chaparral microphones • Fitting the model to the calibrations • Estimation of the nominal Chaparral • frequency response
Chaparral microphone • High gain: 0.2 V/Pa • Low gain: 0.04 V/Pa • Bandwidth: 0.02 – 50 Hz
UAF Field Calibrator • Pressures: 1 Pa, 10 Pa • (internal bellows) • Frequencies: 0.02 Hz, 0.1 Hz • 1.0 Hz • Phase synchronization • Step compression and rarefaction • Volume = 103 cm3 (1 L), • 104 cm3 (10 L) Calibrator and power supply
Calibrations of FairbanksIS53 microphones • Calibrations were made in a building with control of temperature, etc. • At 1Hz, all sensors within 5% • variations at 0.02Hz due to variations in sensor parameters (leak res., diaphragm)
Calibrations of Windless BightIS55 microphones • Amplitude variations across sensors at one frequency is of the order of 10%. • Under arctic conditions precise control of the calibrator functions is difficult
Chaparral sensor/calibrator schematic • V = 103 cm3 • v = 2,660 cm3 • r 15,000 • RB 1 - 10 • b 2x10⁻³ cm5/dyne Sensor Response: R = (P-p)/PB
Model equations for Chaparral microphones under calibration dP/dt = (dP/dt)R + (dP/dt)r + (dP/dt)b dp/dt = (dp/dt)r + (dp/dt)b Parameters: Diaphragm: b Leak resistance: r Fore-volume: V Back-volume: v Bellows resistance: RB Acoustic resistance: R=P/(dV/dt) Diaphragm constant: b = V/P Adiabatic gas law: PV = C dP/dt = (Pa/V) [ (PB-P)/RB + (p-P)/r + b d(p-P)/dt ] dp/dt = (Pa/V) [ (P-p)/r + b d(P-p)/dt ] Sensor Response: R = (P-p)/PB Burridge, R. Geophys. J. R. astr. Soc. 26, 1971. Mutschlecner, J. & R. Whitaker, LANL rept: LA13257, 1997
Chaparral response under calibration, varying leak resistance (r) The low-corner frequency is determined primarily by the acoustic resistance of the leak
Chaparral response under calibration,diaphragm constant (b) The diaphragm constant, b, defines the sensitivity of the sensor but also affects the low-corner frequency
Least-squares search on b-r to fit calibration low-corner frequency
Least-squares search on b-r to fit calibration low-corner frequency • the minimum in b is very sharp, varies less than 10% for all microphones • the minimum in r is broad, varying by a factor of 2-3 for all microphones
Nominal Chaparral response,field operation parameters After calibration the the response function can be calculated using the actual microphone fore-volume and pipe resistances
Results of the analysis • The field calibrator produces repeatable results to within approximately 10% under severe arctic conditions in Antarctica. In controlled conditions repeatability is within approximately 5%. • The Chaparral microphones tested were from several different manufacturing runs and produced similar responses. • The Chaparral responses have been stable over several years at the Fairbanks site. • This analysis shows that the field calibrator can be used to verify the operational characteristics of the Chaparral sensors.
Future plans for field calibration • The field calibration results can be used to obtain values of the diaphragm constant, b, and leak resistance, r. (Note: we fitted only the low-frequency calibration value). • Although the least-squares surface shown contains several minima this feature should disappear when the fit is constrained by all three frequencies. • When fitted to three frequencies we expect to obtain estimates of the absolute sensitivities across the band from less than 0.01 Hz to greater than 1.0 Hz.