Download
1 / 9
100 likes | 357 Vues
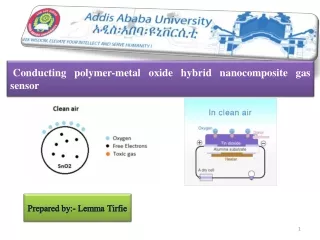
Calibration of Gas Sensors. Block Diagram of Setup. 500 sccm. 200 sccm Flow rate. Pure Nitrogen. CO2 1028 ppm. 200 sccm. MFC. Sensor details. TGS 4161 Figaro- co 2 Range: 350 ppm -10000ppm Atmospheric concentration: 350-400 ppm Calibrated range: 350-900 ppm.

E N D
Block Diagram of Setup 500 sccm 200 sccm Flow rate Pure Nitrogen CO2 1028 ppm 200 sccm
Sensor details • TGS 4161 Figaro- co2 • Range: 350 ppm -10000ppm • Atmospheric concentration: 350-400 ppm • Calibrated range: 350-900 ppm
Comments • PPM is inversely proportional to o/p voltage • Emf’s at 350 ppm is consistent (Column B) • Transition from synthetic air to 350 ppm is consistent.(Column E) • But, transition from base value of 350 ppm totest gas concentration is not the values that we are looking for.(Column G) the value’s should have slightly higher as per data sheet.
As per data sheet Note: The maximum change in emf that we noticed is around 12 mv. These should have been little bit higher as per data sheet.
Δ ppm v/s Δ EMF X-axis Δ PPM Y-axis Δ EMF