Exploring Population Growth: S-Curve Vs J-Curve
110 likes | 251 Vues
Understand population curves & growth concepts through sketching, describing, & interpreting. Discuss limiting factors & carrying capacity in graphs. Compare exponential and realistic models.

Exploring Population Growth: S-Curve Vs J-Curve
E N D
Presentation Transcript
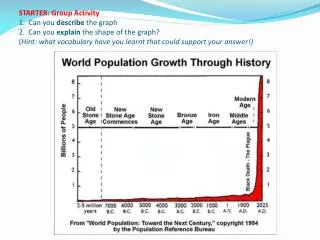
STARTER: Group Activity1. Can you describe the graph2. Can you explain the shape of the graph? (Hint: what vocabulary have you learnt that could support your answer!)
Learning outcomes All of you will be able to: • Describe S and J population curves Most of you should be able to: • Explain the concepts of limiting factors and carrying capacity in the context of population growth. • Sketch and construct population curves from given data. Some of you might be able to: • Interpret population curves.
Population Growth J-curve Exponential growth THINK: What is happening? Why is this IMPROBABLE!
S-curve Transitional phase carrying capacity THINK: Why is this a more realistic model of population growth? Use the terms carrying capacity and limiting factors in your description.
Population growth • Compare the 2 curves • Why is there a difference? LIMITING FACTORS WHICH SET THE CARRYING CAPACITY!!!
Checking learning outcomes Get out your learning outcome booklets… • Who thinks they could describe the S and J curves? • Who thinks they could now sketch and explain their own S and J curves?
Let’s do it… • Sketch and label a graph of an S-curve and a J-curve • Write a short paragraph for each graph -explainingthe shape -using the concepts of limiting factors and carrying capacity Be ready to swap it with your neighbour!
An example of exponential growth cane toad Bufomarinus in Australia