Enhancing Student Outcomes through AIMSweb Data Analysis and Instructional Planning
This session focuses on the importance of administering and analyzing data from universal screeners like AIMSweb to support student academic growth, behavior, and character development. Participants will learn about various AIMSweb reports, including how to create effective instructional strategies based on data trends. Additionally, we will explore the principal's role in using AIMSweb data to inform decision-making and intervention strategies within a multi-tiered system of supports (MTSS). This collaborative approach ensures timely and effective interventions for all students.

Enhancing Student Outcomes through AIMSweb Data Analysis and Instructional Planning
E N D
Presentation Transcript
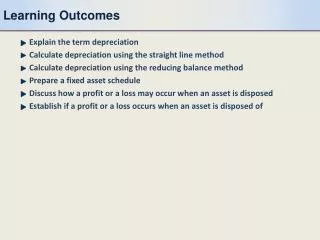
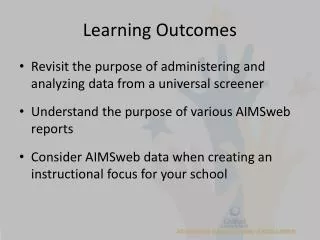
Learning Outcomes • Revisit the purpose of administering and analyzing data from a universal screener • Understand the purpose of various AIMSweb reports • Consider AIMSweb data when creating an instructional focus for your school
The REALLY Big Picture: Strategic Plan - 2016 I.33 Provide high quality, research-based interventions for students. Provide a multi-tiered system of supports (MTSS) that ensures students receive effective and timely interventions to support academic learning, behavior and character development. Develop interventions based on assessment data, teacher observations and other tools.
The REALLY Big Picture • AIMSweb data cannot tell us everything about a student • Other data sources: • EOGs • Grades • Interims • Attendance • Behavior • Other school-based assessments (SRI, Common Assessments, Phonics Inventory, etc.)
AIMSweb: Potential Roles of the Principal • Familiarize self with screening tools • Develop building infrastructure (time, place personnel) for screenings, e.g., “SWAT” teams • Ensure that the individuals who are administering the screening have been trained in using the chosen CBM materials • “Institutionalization” of process of using screening data to make predictions and for instructional decision making
AIMSweb: Potential Roles of the Principal • Develop meeting time or team planning time for DATA meetings • Scheduled Data Days • Calendar of screening, DATA meetings for entire school year
AIMSweb: Potential Roles of the Principal • You have to inspect what you expect • Principal walkthroughs • Core and intervention program fidelity checks • Are we all doing what we agreed to do?
AIMSweb Reports Review • Tier Transition – How are students moving between levels from one assessment to the next? • Look at by grade level or by class • Normative Performance Table – How do the growth rates compare by achievement levels? • Look at by school to compare to national norm or district average • Improvement Report – Visualize the growth trajectory • Look at by grade level or by class • Summary of Impact of Instructional Program – Individual student growth • Look at by grade level or by class • Scores and Percentiles (The Rainbow Report) – gives a variety of information about student performance on a specific assessment • Look at by grade level or by class
Additional AIMSweb Reports • Individual Student Report • Pathway Report • Compare This School • Comparison Report • Instructional Recommendations Report
Additional AIMSweb Reports • Individual Student Report – a visual representation of how one student is performing on a measure compared to a representative group (national, state, district, or school) • Run from Class tab (click individual score) • Pathway Report – displays scores for a single student for measures of one type compared to a representative group • Run from Class tab (final column) • Compare This School – shows a comparison between one grade level and the district on one measure • Run from school tab • Comparison Report – shows a comparison between one grade level and the district on one measure across each benchmark period • Run from grade tab • Instructional Recommendations Report – separates students into performance levels and makes recommendations about moving forward with those students • Run from grade or class tab
Using the Reports • Examine the scenarios you have been given. • Work with a partner to decide which report you would use for each situation. You will use some of the reports we have discussed previously and some of the reports that were shared today. • Whole Group Discussion
Areas of Instructional Focus • How can student data be used to make instructional decisions and to create an instructional focus? • Small group discussions • What is this data telling you? • What would you do to address this data? Think about structures, support, and instructional focus. • What other data points will you need to finish creating your plan? • Whole Group Sharing
Moving Forward • Growth expectations are based on current level of performance • Always consider, if a student reaches their growth goal, where will they be at the end of the year? • It’s not about getting kids to green, it’s about getting kids to grow.
Closing • What are your take-aways from this session? • Question? • Please feel free to contact any of us if you have questions that arise as you continue to work with AIMSweb in your school.