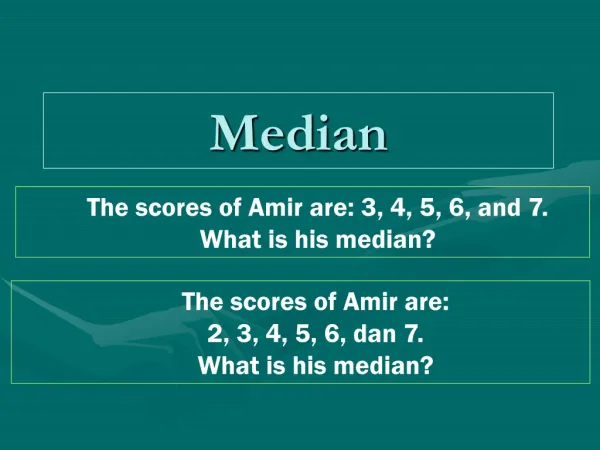

Median
E N D
Presentation Transcript
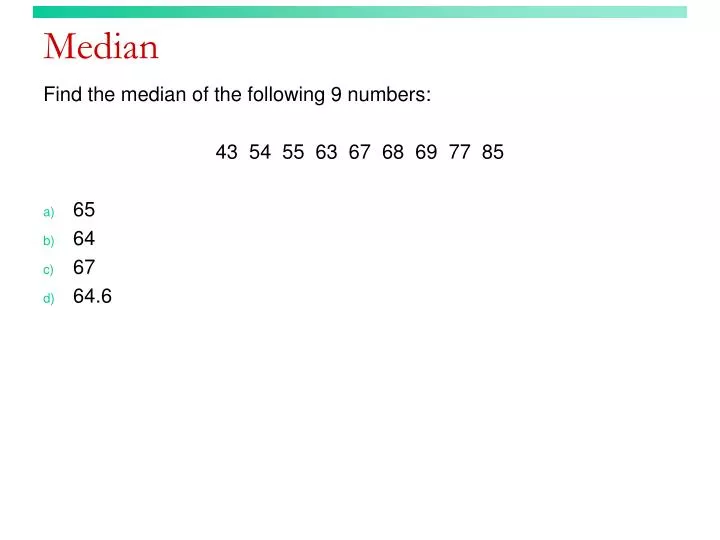
Median Find the median of the following 9 numbers: 43 54 55 63 67 68 69 77 85 • 65 • 64 • 67 • 64.6
Median For the data in the previous question, 43 54 55 63 67 68 69 77 85 Suppose that the last data point is actually 115 instead of 85. What effect would this new maximum have on our value for the median of the dataset? • Increase the value of the median. • Decrease the value of the median. • Not change the value of the median.
Mean For the data in the previous question, 43 54 55 63 67 68 69 77 85 Suppose that the last data point is actually 115 instead of 85. What effect would this new maximum have on our value for the mean of the dataset? • Increase the value of the mean. • Decrease the value of the mean. • Not change the value of the mean.
Mean vs. median For the dataset “volumes of milk dispensed into 2-gallon milk cartons,” should you use the mean or the median to describe the center? • Mean • Median
Mean vs. median For the dataset “sales prices of homes in Los Angeles,” should you use the mean or the median to describe the center? • Mean • Median
Mean vs. median For the dataset “incomes for people in the United States,” should you use the mean or the median to describe the center? • Mean • Median
Boxplots Below you have a boxplot for the tar content of 25 different cigarettes. What is a plausible set of values for the five-number summary? • Min = 13, Q1 = 10, Median = 12.6, Q3 = 14, Max = 15 • Min = 1, Q1 = 8.5, Median = 12.6, Q3 = 15, Max = 17 • Min = 1, Q1 = 8.5, Median = 11.5, Q3 = 13, Max = 15 • Min = 8.5, Q1 = 10, Median = 11.5, Q3 = 15, Max = 17
Boxplots The shape of the boxplot below can be described as: • Bi-modal • Left-skewed • Right-skewed • Symmetric • Uniform
Side-by-side boxplots Look at the following side-by-side boxplots and compare the female and male shoulder girth. • Females have a typically smaller shoulder girth than males. • Females have a typically larger shoulder girth than males. • Females and males have about the same shoulder girths.
Side-by-side boxplots Look at the following side-by-side boxplots and compare the female and male thigh girth. • Females have a typically smaller thigh girth than males. • Females have a typically larger thigh girth than males. • Females and males have about the same thigh girth.
Comparing two histograms Compare the centers of Distribution A (Female Shoulder Girth) and Distribution B (Male Shoulder Girth) shown below. • The center of Distribution A is greater than the center of Distribution B. • The center of Distribution A is less than the center of Distribution B. • The center of Distribution A is equal to the center of Distribution B.
Comparing two histograms Compare the spreads of Distribution A (Female Shoulder Girth) and Distribution B (Male Shoulder Girth) shown below. • The spread of Distribution A is greater than the spread of Distribution B. • The spread of Distribution A is less than the spread of Distribution B. • The spread of Distribution A is equal to the spread of Distribution B.
Boxplots What is the approximate range of the Male Wrist Girth dataset shown below? • 14.5 to 19.5 • 16.5 to 17 • 16.5 to 18 • 17 to 19.5 • 14.5 to 16.5 and 18 to 19.5
Boxplots What is the approximate interquartile range of the Male Wrist Girth dataset shown below? • 14.5 to 19.5 • 16.5 to 17 • 16.5 to 18 • 17 to 19.5 • 14.5 to 16.5 and 18 to 19.5
Outliers If a dataset contains outliers, which measure of spread is resistant? • Range • Interquartile range • Standard deviation • Variance
Standard deviation Which of the following statements is TRUE? • Standard deviation has no unit of measurement. • Standard deviation is either positive or negative. • Standard deviation is inflated by outliers. • Standard deviation is used even when the mean is not an appropriate measure of center.
Center and spread For the following distribution of major league baseball players’ salaries in 1992, which measures of center and spread are more appropriate? • Mean and standard deviation • Median and interquartile range