

SlideServe
Menu
Préférences
© SlideServe · v2026

New Topic - Waves

boyce avatar
16 diapositives · 489 Views · Sep 15, 2014

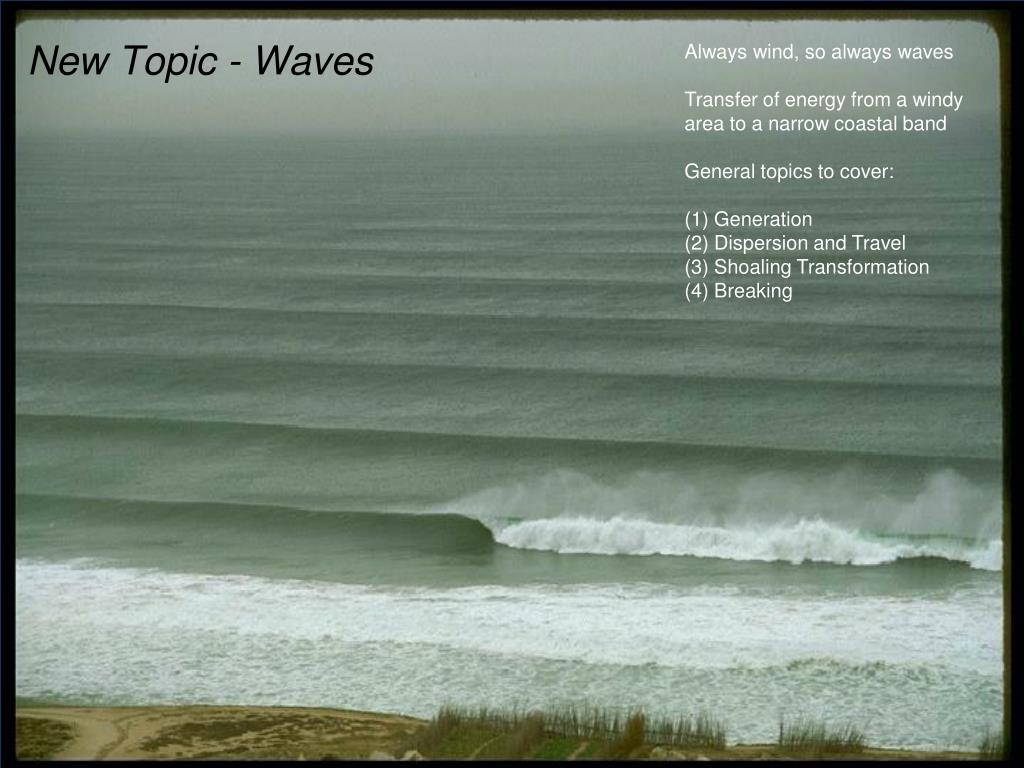
New Topic - Waves. Always wind, so always waves Transfer of energy from a windy area to a narrow coastal band General topics to cover: (1) Generation (2) Dispersion and Travel (3) Shoaling Transformation (4) Breaking. Sea, Swell, Surf. Wave Anatomy - Periodic Waves.
New Topic - Waves - slide 1
01 / 16New Topic - Waves
1 / 17

Télécharger la présentation

New Topic - Waves
Une image / un lien ci-dessous est fourni (tel quel) pour télécharger la présentation

Politique de téléchargement : le contenu du site vous est fourni TEL QUEL pour votre information et votre usage personnel ; il ne peut être vendu, concédé sous licence ni partagé sur d’autres sites sans l’accord de son auteur.Le contenu vous est fourni TEL QUEL, pour votre information et votre usage personnel uniquement. Téléchargez la présentation en cliquant sur ce lien. Lors du téléchargement, si vous ne parvenez pas à télécharger une présentation, l’éditeur a peut-être supprimé le fichier de son serveur.Pendant le téléchargement, si vous ne parvenez pas à obtenir une présentation, le fichier a peut-être été supprimé par l’éditeur.

F I N

Plus de contenu associé

Transcription de la présentation
  1. New Topic - Waves Always wind, so always waves Transfer of energy from a windy area to a narrow coastal band General topics to cover: (1) Generation (2) Dispersion and Travel (3) Shoaling Transformation (4) Breaking

  2. Sea, Swell, Surf

  3. Wave Anatomy - Periodic Waves Can think of waves w.r.t. a spatial framework, or w.r.t. a temporal framework. T = wave period f = wave frequency = 1/T L = wave length C = L/T = phase velocity or celerity H = wave height  = water surface displacement h = water depth d = horizontal water particle orbital diameter s = vertical water particle orbital diameter u = horizontal water particle velocity w = vertical water particle velocity

  4. Motion of water in waves Red dot on the surface - sees the wave form pass, but moves in a circular orbit When red dot is at bottom of it’s orbital, it’s in the trough of the wave, when at the top of its orbital, it’s at the crest of the wave Orbital size (diameter) decreases with depth Waves propagate through the medium

  5. Dispersion – sorting by wave period

  6. Formation of Wave Groups two wave trains of slightly different wave lengths, superposed, can create wave groups

  7. Wave Superposition run animation of wave superposition

  8. Spectral Energy of Water Level Fluctuations Classification of wave motions is based on restoring force.

  9. Wave Measurement Three main types of in-situ measurement devices: Surface Piercing Pressure Sensing Surface Following Other Measurement Considerations: Directional Measurements Satellites

  10. Wave Heights from a Time Series of Water Levels Zero up-crossing vs. zero down-crossing

  11. Wave Analysis Statistical Analysis - time domain analysis which uses a wave height measurement technique (e.g. zero upcrossing) to determine a series of characteristic heights (Hsig, Hrms, H1/10, Hmax) vs. Spectral Analysis – which is carried out in the frequency domain, and is a fairly standard technique today.

  12. “Characteristic Waves” Derived from a Time Series of Wave Heights

  13. MATLAB examples of artificial waves fft analysis and Santa Cruz deep & shallow waves fft analysis Fourier Analysis – based on the concept that any complex time series can be represented by a combination of various sine and cosine functions. By performing a Fourier Transform of the “time domain” data, we obtain a function in the “frequency domain” which describes which frequencies are present in the original function.

  14. Frequency-Direction Spectra Use Fourier Analysis to deconvolve individual wave components Can Identify Spectra of Frequencies and Spectra of Directions Example above shows 2 distinct wave sources Representative Values? Hs = H1/3 = 4s = 4*sqrt(var) Hrms = 2*sqrt(2)*sqrt(var) fp, the frequency at the spectral peak qp, the direction at the spectral peak http://cdip.ucsd.edu/

  15. Wave Data Sources - NOAA/NDBC http://www.ndbc.noaa.gov/ Other sources: WIS

  16. Analyses of Wave Records - Extreme Events Akin to flood-frequency prediction in hydrology: Don’t have a hundred year long record? Extrapolate! Rank the annual highs (Hsig) Pn = n/(N+1) R = 1/(1-P(H)) 5. Special paper - Weibull distribution plots a straight line