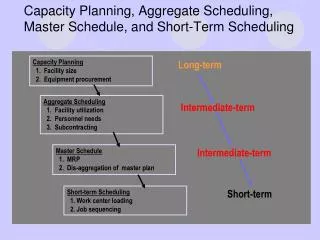
Capacity Planning: Break-Even Analysis
Capacity Planning Break-Even Point Ardavan Asef-Vaziri Systems and Operations Management College of Business and Economics California State University, Northridge. Capacity Planning: Break-Even Analysis . Operation costs are divided into 2 main groups:

Capacity Planning: Break-Even Analysis
E N D
Presentation Transcript
Capacity PlanningBreak-Even PointArdavan Asef-VaziriSystems and Operations ManagementCollege of Business and EconomicsCalifornia State University, Northridge
Capacity Planning: Break-Even Analysis • Operation costs are divided into 2 main groups: • Fixed costs – Costs of Human and Capital Resources • wages, depreciation, rent, property tax, property insurance. • the total fixed cost is fixed throughout the year. No matter if we produce one unit or one million units. It does not depend on the production level. • fixed cost per unit of production is variable. • Variable costs – Costs of Inputs • raw material, packaging material, supplies, production water and power. • The total variable costs depend on the volume of production. The higher the production level, the higher the total variable costs. • variable cost per unit of production is fixed.
Five Elements of the Process View Process Management Information structure Network of Activities and Buffers Inputs (natural or processed resources, parts and components, energy, data, customers, cash, etc.) Outputs Goods Services Flow Unit Human & Capital Fixed Resources Variable
Fixed cost per unit of product (F/Q) Total Fixed Cost and Fixed Cost per Unit of Product Total fixed cost (F) Production volume (Q) Production volume (Q)
Variable Cost per Unit and Total Variable Costs Variable costs Per unit of product Total Variable costs (VQ) (V) Production volume (Q) Production volume (Q)
Total Costs TC = F+VQ Total cost = F+VQ Total Costs in $ (TC) Total variable cost (VQ) Total Fixed cost (F) 0 Volume of Production and Sales in units (Q)
Total Revenue It is assumed that the price of the product is fixed, and we sell whatever we produce. Total sales revenue depends on the production level. The higher the production, the higher the total sales revenue.
Break-Even Computations Profit Total cost = F+VQ Total Costs or Revenue in $ (TC) Loss Total Revenue (PQ) Break-Even Point Volume of Production and Sales in units (Q)
Example 1 $1000,000 total yearly fixed costs. $200 per unit variable costs $400 per unit sale price TR = TC 400Q= 1000,000+200Q (400-200)Q= 1000,000 Q= 5000 QBEP=5000 If our market research indicates that the present demand is > 5,000, then this manufacturing system is economically feasible.
A Simple technology An Intermediate technology An Advanced technology General purpose machines Multi-purpose machines Special purpose machines Low F high V In between High F Low V BEA for Multiple Alternatives Break-even analysis for multiple alternatives: Such an analysis is implemented to compare cases such as In general, when we move from a simple technology to an advanced technology; F V
BEA for Multiple Alternatives Flow-Shop Batch Job-Shop Q1 Q2
Example 2 Management should decide whether to make a part at house or outsource it. Outsource at $10 per unit. To make it at house; two processes: Advanced and Intermediate (1) At house with intermediate processFixed Cost: $10,000/yearVariable Cost: $8 per unit (2) At house with advanced process.Fixed Cost: $34,000/yearVariable Cost: $5 per unit Prepare a table to summarize your recommendations. Demand Recommendation R <= ? ? ? < R < = ? ? ? < R ?
Example 2. BEA for Multiple Alternatives Manufacture II Manufacture I Outsource Q1 Q2
100000 90000 80000 70000 60000 50000 40000 30000 20000 10000 1000 3000 4000 5000 6000 7000 8000 9000 10000 2000 Example 2. Outsource vs. Manufacturing I 10000+8Q=10Q 2Q=10000 10,000+8Q 10Q Q=5000
100000 90000 80000 70000 60000 50000 40000 30000 20000 10000 1000 3000 4000 5000 6000 7000 8000 9000 10000 2000 Example 2. Manufacturing I vs. Manufacturing II 10000+8Q=34000+5Q 3Q=24000 34,000+5Q 10,000+8Q Q=8000
Example 2. Executive Summary We summarize our recommendations as Demand Recommendation R <= 5000 Buy 5000 < R < = 8000 Manufacture Alternative I 8000 < R Manufacture Alternative II
Example 3. BEA for Multiple Alternatives Three alternatives 1) Job-Shop Total Fixed Cost F = $10,000, Variable cost V = $10 per unit 2) Batch Processing Total Fixed Cost F = $60,000, Variable cost V = $5 per unit 3) Flow-Shop Total Fixed Cost F = $150,000, Variable cost V = $2 per unit Tell me what to do: In terms of the range of demand and the preferred choice…
Example 3. BEA for Multiple Alternatives Flow-Shop Batch Job-Shop Q1 Q2
Example 3. BEA, Job-Shop vs. Batch Processing Batch Processing Job-Shop Q1
Q = Example 3. BEA, Job-Shop vs. Batch Processing F1=10000 V1=10 F2=60000 V2=5 Break-even of 1 and 2 F1+ V1 Q = F2+ V2 Q 10000+10Q = 60000 + 5Q
Example 3. Batch Processing vs. Flow Shop Flow-Shop Batch Processing Q2
Q = Example 3. Batch Processing vs. Flow Shop F2=60000 V2=5 F3=150000 V3=2 Break-even of 2 and 3 F2+ V2 Q = F3+ V3 Q 60000 + 5Q = 150000+2Q
Recommendations to Management and Marketing DemandRecommended Alternative D < 10000 Job-Shop 10000 < D < 30000 Batch Processing 30000 < D Flow-Shop We also need to know Price and Revenue! Suppose sales price is $8 per unit. Revise the table
Recommendations to Management and Marketing Alternative 1 has a variable cost of $10>$8 will never use it Alternative 2 has a variable cost of $5<$8 Alternative 3 has a variable cost of $2<$8 As we saw before, Alternatives 2 and 3 break even at 30,000 If demand is greater than 30,000, we use alternative 2. Now we can compute the break-even point of Alternative 2. Can you analyze the situation before solving the problem? If the break-even point for alternative 2 is X and is greater than 30,000, then we never use Alternative 2 since beyond a demand of 30,000, Alternative 3 is always preferred to Alternative 2. D < X Do nothing D> X Alternative 3 Lets see where is the BEP of alternative 2 F+VQ = PQ 60,000+5Q=8Q Q= 20,000.
Recommendations to Management and Marketing D < 20,000Do nothing 20,000 < D < 30,000 Alternative 2 30,000 < D Alternative 3 If sales price was $6.5 instead of $8, then F+VQ = PQ 60,000+5Q=6.5Q Q= 40,000. But for Q> 30,000 you never use Alternative 2, but Alternative 3 Where Alternative 3 breaks even? 150000+2Q = 6.5Q 150000 = 4.5 Q Q = 33333 D < 33333 Do nothing D> 30,000 Alternative 3
Example 4. BEP for the Three Global Locations You’re considering a new manufacturing plant in the sites at the suburb of one of the three candidate locations of: Bristol (England), Taranto (Italy), or Essen (Germany). Total Fixed costs (costs of human and capital resources) per year and variable costs (costs of inputs) per case of product is given below Bristol (England) F = $300000, V = $18 Essen (Germany): F = $600000, V = $12 Taranto (Italy): F = $900000, V = $9
Example 3. BEA for Multiple Alternatives Taranto Essen Bristol Q1 Q2
Example 3. BEA for Multiple Alternatives Taranto Essen Bristol Q1 Q2
Example 4. BEP for the Three Global Locations 1. At what level of demand a site at Bristol suburb is preferred? Bristol Total Costs = 300000+18Q Essen Total Costs = 600000+12Q 300000+18Q = 600000+12Q 6Q = 300,000 Q = 50,000 2. At what level of demand is a site at Essen suburb preferred? Essen Total Costs = 600000+12Q Taranto Total Costs = 900000+9Q 600000+12Q = 900000+9Q 3Q = 300,000 Q = 100,0000 Essen is preferred for 100,000≥ Q ≥ 50,000
Example 3. BEA for Multiple Alternatives Taranto Essen Bristol 50000 100000
Example 4. BEP for the Three Global Locations 3. At what level of demand a site at Taranto suburb is preferred? More than 100,000 4. Suppose sales price is equal to the average of the variable costs at Bristol and Essen. At what level of demand is a site at Bristol suburb preferred? Never 6. Given the same assumption as (4). At what level of demand a site at Essen suburb is preferred? P = (18+12)/2 = 15 Total Essen cost = 600,000 + 12Q PQ = F + VQ 15Q = 600,000 + 12Q 3Q = 600,000 Q = 200,000 Never. Why???
Example 5. BEP for the Three Global Locations Why At Q = 100,000 Taranto dominates Essen 5. Given the same assumption as (4). At what level of demand is a site at Taranto suburb preferred? P = (18+12)/2 = 15 Taranto Total cost = 900,000 + 9Q PQ = F + VQ 15Q = 900,000 + 9Q 6Q = 900,000 Q = 150,000 P =15 D ≤ 150000No Where D ≥ 150,000 Taranto
Example 5. BEP for the Three Global Locations 7. Suppose sales price is $20. At what level of demand a site at Essen suburb is preferred? Essen Total cost = 600,000 + 12Q 20Q = 600,000+12Q Q = 75000 From 75000 to ?? At what level of demand a site at Essen is preferred? At 100,000 Essen and Taranto Break Even – After that Taranto denominates From 75,000 to 100,000 P= 20 75,000 ≤ D ≤ 100000 Essen D ≥ 100,000 Taranto
Financial Throughput and Fixed Operating Costs We define financial throughput as the rate at which the enterprise generates money. By selling one unit of product we generate P dollars, at the same time we incur V dollars pure variable cost. Pure variable cost is the cost directly related to the production of one additional unit - such as raw material. It does not include sunk costs such as salary, rent, and depreciation. Since we produce and sell Q units per unit of time. The financial throughput is Q(P-V). Fixed Operating Expenses (F) include all costs not directly related to production of one additional unit. That includes costs such as human and capital resources. Throughput Profit Multiplier = % Changes in Profit divided by % Changes in Throughput 1% change in the throughput leads to TPM% change in the profit
Financial Throughput and Fixed Operating Costs Suppose fixed cost F = $180,000 per month. Sales price per unit P = 22, and variable cost per unit V = 2. In July, the process throughput was 10,000 units. A process improvement increased throughput in August by 2% to 10,200 units without any increase in the fixed cost. Compute throughput profit multiplier. July: Financial Throughput = 10000(22-2) = 200000 Fixed cost F = 180,000 Profit = 200000-180000 = $20,000 In August throughput increased by 2% to 10200 August: Financial Throughput of the additional 200 units = 200(22-2) = 4,000 We have already covered our fixed costs, the $4000 directly goes to profit.
Throughput Profit Multiplier (TPM) % Change in Throughput = 2% % change in profit = 4000/20000 = 20% Throughput Profit Multiplier (TPM) = 20%/2% = 10 1% throughput improvement 10% profit improvement
A Viable Vision – EliyahuGoldrat A Viable Vision (Goldratt): What if we decide to have todays total revenue as tomorrows total profit. In our example, Financial Throughput in July was Q1(P-V) = 10,000(22-2). In order to have your profit equal this amount we need to produce Q2 units such that: Q2(P-V) – F = Q1(P) Q2(20) -180,000 = 10,000(22) Q2(20) = 40,000 Q2 = 20,000 In order to have your todays total revenue as tomorrows total profit. We only need to double our throughput. Our sales, our current revenue becomes our tomorrows profit.
Example 5 A manager has the option of purchasing 1, 2 or 3 machines. The capacity of each machine is 300 units. Fixed costs are as follows: Number of Machines Fixed cost Total Capacity 1 $9,600 1-300 2 $15,000 301-600 3 $20,000 601-900 Variable cost is $10 per unit, and the sales price of product is $40 per unit. Tell management what to do!
Example 5. BEP Recommendations Prepare an executive summary similar the following: R<= ? ? ?<R<=? ? R>? ? Now it is up to the Marketing Department to provide an Executive Summary regarding the demand.
40000 35000 30000 25000 20000 15000 10000 5000 100 300 400 500 600 700 800 900 1000 200 BEP: One Machine The beak-even point for 1 machine is 320 But one machine can not produce more than 300 Demand <= 300 No Production Otherwise Consider two machines 40Q 9600+10Q 9600 + 10Q = 40Q 9600= 30Q 320
40000 35000 30000 25000 20000 15000 10000 5000 100 300 400 500 600 700 800 900 1000 200 BEP: Two Machine The beak-even point for 2 machine is 500 Demand <= 500 No Production Otherwise Two machines and consider 3 machines 40Q 15000+10Q 15000 + 10Q = 40Q 15000= 30Q 500
40000 35000 30000 25000 20000 15000 10000 5000 100 300 400 500 600 700 800 900 1000 200 BEP: Three Machine The beak-even point for 3 machine is 667 Demand <= 667 Produce up to 600 using 2 machine Otherwise 3 machines 40Q 20000+10Q 20000 + 10Q = 40Q 20000= 30Q 667
BEP for the Three Alternatives and Recommendations Prepare an executive summary similar the following: R<= 500 Do nothing 500 <R<=667 Buy two machines and produce 500< Q<= 600 Q>667 Buy three machines and produce 667<R<=900 Now it is up to the Marketing Department to provide an Executive Summary regarding the demand. Please Think again!. We have made a mistake.
40000 35000 30000 25000 20000 15000 10000 5000 100 300 400 500 600 700 800 900 1000 200 BEP: Two Machine- Revisited TC = 15000 + 10(600) TC = 21000 TR = 40(600) = 24000 Profit = 24000-21000 = 3000 40Q } 15000+10Q You do not switch to 3 machines unless you make 3000 profit 600
At Q = 667 you make 0 profit with 3 machines From Wrong to Right Recommendations Q<= 500 Do-Nothing 500<Q<=667 Buy two machines and produce 500<Q<= 600 Q>667 Buy three machines and produce 667<Q<=900 20000 + 10Q = 40Q 20000= 30Q Q = 667 20000 + 10Q +3000= 40Q 23000= 30Q Q = 767
Executive Summary Q<= 500 Do-Nothing 500<Q<=767 Buy two machines and produce 500<Q<= 600 Q>767 Buy three machines and produce 767<Q<=900 Now it is to Marketing Department to provide executive summary regarding the demand
Example 5- At Your Own Will You are the production manager and are given the option to purchase either 1, 2 or 3 machines. Each machine has a capacity of 500 units. Fixed costs are as follows: Number of Machines Fixed cost Total Capacity 1 $19,200 1- 500 2 $30,000 501-1000 3 $40,000 1001-1500 Variable cost is $35 per unit, and the sales price of product is $69 per unit. Determine the best option!
BEP for the Three Alternatives and Recommendations Prepare an executive summary similar the following: R<= ? ? ?<R<=? ? R>? ?