Optimizing Enzyme Immobilization on Nano-Porous Silica via Pore Size Analysis
150 likes | 243 Vues
This study synthesized nano-porous silica supports for enzyme immobilization through a salt route. D-amino acid oxidase was immobilized in the silica, and the immobilization yield was investigated based on silica morphologies. Results show that pore size distribution significantly affects immobilization yield, with the highest yield observed in pores of 40-50nm. The study highlights the importance of pore diameter on enzyme immobilization efficiency. Experimental data including Langmuir coefficient, BET surface area variations, BSA adsorption, and protein adsorption kinetics are presented and analyzed. Additionally, the principles and advantages of Confocal Laser Scanning Microscopy for image processing and analysis are discussed.

Optimizing Enzyme Immobilization on Nano-Porous Silica via Pore Size Analysis
E N D
Presentation Transcript
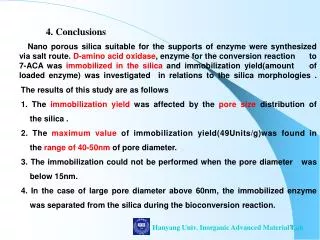
4. Conclusions Nano porous silica suitable for the supports of enzyme were synthesized via salt route. D-amino acid oxidase, enzyme for the conversion reaction to 7-ACA was immobilized in the silica and immobilization yield(amount of loaded enzyme) was investigated in relations to the silica morphologies . The results of this study are as follows 1. The immobilization yield was affected by the pore size distribution of the silica . 2. The maximum value of immobilization yield(49Units/g)was found in the range of 40-50nm of pore diameter. 3. The immobilization could not be performed when the pore diameter was below 15nm. 4. In the case of large pore diameter above 60nm, the immobilized enzyme was separated from the silica during the bioconversion reaction. Hanyang Univ. Inorganic Advanced Material Lab
Table 1. Characteristics of the nano-pore silica particle used.
Table 2. Experimental Langmuir coefficient. Kd: dissociation constant (g/l), qm: maximum protein adsorption (mg/g silica particle), R2: correlation coefficient.
(a) Fig. 1. Variations of the BET surface area and pore size with polymerization time in acid and base solution. Cycle (●) is acid polymerization and invertedtriangle (▼) is base polymerization. (b)
Fig. 2. BSA adsorption at each pH condition. Sample #1 (●): 80 m2/g, sample #2 (▼): 280 m2/g, sample #3 (■): 250 m2/g.
Fig. 3. Langmuir plots of BSA adsorption on silica particles. The BSA was adsorbed at various initial protein concentrations (0.1, 0.2, 0.5, 1.0, 2.0 mg/ml) and pH 5 after 1 hour incubation. Sample #4 (▲) 45 nm pore size,sample #5 (◆) 25 nm, sample #6 (■) 12.7 nm, sample #7 (▼) 6.8 nm, sample #8 (●) 2.2 nm.
Fig. 4. Effect of pore size on adsorption kinetics at 0.2 mg/ml initial BSA concentration. Sample #4 (▲) 45 nm pore size,sample #5 (◆) 25 nm, sample #6 (■) 12.7 nm, sample #7 (▼) 6.8 nm, sample #8 (●) 2.2 nm.
< 공초점의 원리 > • Slit의 위치를 시료의 focus 위치와 동일하게 • 조절하여 out-of-focus blur시그널 제거. -레이저 초점을 고속 scanning하여 이미지 프로세싱함으로써 2,3 차원 영상 이미지 재현. < 요소 기술 > -공초점 핀홀 제작 및 조절 기술. -다차원 영상 구현을 위한 초고속 레이저 스케닝 기술. -고해상도 영상 처리 기술. Confocal Laser Scanning Microscopy의 장점: 공초점 원리를 이용하므로 고전적 광학 현미경에 비하여 뛰어난 해상력을 가짐.
a b c d 마이크로 회로의 공초점 이미지와 비공초점 이미지 간의 비교 (a) 비공초점 반사 이미지 : 상하 부분의 영상이 선명치 않음. (b) 공초점 이미지 : 상하 의 비초점 영역은 어둡게 나타남 (c) 공초점 스케닝 이미지 : 레이저 스케닝에 의한 전체 이미지 구현. (d) Depth coding 공초점 이미지.
레이저 스케닝에 의한 2차원 고해상도 광학이미지 구현. • 레이저 초점이 시료 위를 이동. • 측정된 각 초점의 세기들의 픽셀 이미지 생성. • 전자 현미경과 같이 세포를 손상시키지 않고 광학적 절편에 의한 3차원 고해상도 이미지 구현. • 비접촉 광학적 층상 절개. • 측정된 층상의 3차원 재구성. • CT, MR, PET등의 이미지 분석 기술과 비교하여 50nm 이하에서 20482048 픽셀의 고해상도 이미지 구현가능. • 여러 개의 서로 다른 파장 레이저와 검출기 (PMT 또는 CCD)를 결합시켜 신호대잡음비 및 공간 분해능을 증진시킴. 3차원 고해상도 이미지 구현
(a) (b) (c) (d) (e) Fig. 5. Confocal image of an adsorbent particle after incubation with fluorescence labeled BSA. (a) 2.2 nm, (b) 6.8 nm, (c) 12.7 nm, (d) 25 nm, (e) 45 nm pore size.
Fig. 6. Fluorescence intensity profile of cross section of silica after image analysis (intensity in arbitrary units versus particle diameter). Black line: 2.2 nm, red line: 6.8 nm, green line: 12.7 nm, yellow line: 25 nm, blue line: 45 nm pore size.
Fig. 7. Effect of pore size on protein adsorption. The square is maximum BSA adsorption (mg/g) form Table 2 and cycle is integrated fluorescence intensity from Figure 6.