Bias, Confounding and effect modification
Bias, Confounding and effect modification. Jamlick Karumbi, SIRCLE. Outline . What? Types How does it happen Examples Control/minimizing. In any study, association between an outcome and an exposure can be due to; True association or Bias Confounding Random error (chance). Bias.


Bias, Confounding and effect modification
E N D
Presentation Transcript
Bias, Confounding and effect modification Jamlick Karumbi, SIRCLE
Outline • What? • Types • How does it happen • Examples • Control/minimizing
In any study, association between an outcome and an exposure can be due to; • True association or • Bias • Confounding • Random error (chance)
Bias A systematic deviation of results or influences from truth • Any trend in the collection, analysis, interpretation, publication or review of data that can lead to conclusions that are systematically different from the truth (Last, 2001) • A process at any state of inference tending to produce results that depart systematically from the true values (Fletcher et al, 1988) • Systematic error in design or conduct of a study (Szkloet al, 2000) • It’s a form of differential/selective miss-classification.
Identifying a bias • In a case control study to examine risk factors for lung cancer, cases are people admitted with lung cancer, and controls are people admitted to the same hospital with emphysema. • The study finds no association between smoking and lung cancer.
Identifying a random error • If four people wanted to stop smoking, two of them take some nicotine pills to help them stop, and two don’t. the two taking the pills succeed in stopping the habit. A significance test shows a P = 0.03. • We can then conclude that nicotine helps people stop smoking.
Bias Random error vs bias (non random error)
Bias • Bias description differs depending on the study design; • In descriptive studies/observational studies, bias is due to the study population being unrepresentative of general population being described • In analytical studies, bias is due to comparisons groups being not comparable
Types of bias • Mainly divided into two; • Selection bias • Information bias
Selection bias • Systematic differences between those included in the study and those excluded • Mailing a questionnaire to the community so as to estimate the prevalence of disability? • Any problem with that?? • In descriptive studies it occurs when your study population is not representative of the reference population
Selection bias • In analytical studies, the comparison groups are not similar • Case controls; • Cases not representative of all cases in population • Controls not representative of the population from which the cases were selected • Cohort studies • Choice of the unexposed group (health worker effect) • Different follow-up times between the comparison groups
Examples • Self-selection bias • Also called volunteer bias • Health worker effect is a good example • Workers are generally healthy than general population • People in employment may be less or more likely to offer themselves for a study • Self referral..etc • HIV test, who will volunteer??
Examples • Diagnostic bias • Also called hospital admission bias or work up bias • Prior knowledge of exposure by investigator Case control study • Outcome is pulmonary disease, exposure is smoking • Radiologist aware of patient’s smoking status when reading x-ray – may look more carefully for abnormalities on x-ray and differentially select cases
Examples • Loss to follow-up bias • Can also be referred to as withdrawal bias • If its differential then the association will be distorted • Non-response bias • A postal survey on alcohol intake, heavy alcoholics might be less likely to respond, thereby giving an underestimation of the effect.
Minimizing selection bias • Ensure that study participants are a representative of target population, a control can be a case if he had the outcome • Ensure high rates of response as possible and if not examine differences between responders and non-responders
Information bias • An error in exposure or outcome measurement which results in systematic differences between information collected • Sources include; • Subject variation • Observer variation • Tools deficiencies (ruler vs calipers) • Technical errors during measurement • Divided into; • Interviewer/observer bias • Reporting bias
Information bias • Interviewer bias may be in terms of; • Probing/asking • Recording • Interpreting
Reporting bias • It results from subject variation; whereby a subjects have different levels of accuracy depending on exposure, its more common in case-control studies • The exposed group have a greater sensitivity for recalling an exposure. • E.g. those who develop a flu may be more likely to remember the exposure than those who don't,
Also individuals who are aware that they are being followed will behave differently, the so called Hawthorne effect • Reporting and observer bias can result in misclassification – assigning to the wrong exposure or outcome category • Can be differential or non differential
Minimizing information bias • Blinding; if possible double, but at least the investigator and interviewers • Counter checking with medical records for data, e.g. from several sources • In questionnaires multiple questions enquiring about the same information may act as a double check • How you conduct a survey, face to face or mail
Caution! • Its very important that all potential sources of bias are identified at the time of study design because, unlike random error or confounding you can’t adjust or make an allowance for bias at the analysis stage.
In any study, association between an outcome and an exposure can be due to; • True association or • Bias • Confounding • Random error (chance)
Confounding • If a study found an association between coffee drinking and lung cancer. • Do we ban coffee or are there alternative explanations?
Confounding • It is a situation where the association between an exposure and an outcome is entirely or partially due to another exposure. • Some may call it ‘confusion of effects’ • It leads to distortion of the effect which can be an under or over estimation, it can even change the direction of an effect.
Characteristics of a confounder • Must be associated with exposure among the source population (controls), • Should be an independent risk factor among non exposed • Not on the causal pathway of the exposure of interest and the outcome.
Confoundernota result of the exposure • e.g., association between grey hair(exposure) and heart attack (outcome); Is age a confounder? • e.g., association between age(exposure) and heart attack (outcome); Is grey hair a confounder?
Confounding To be a confounding factor, three conditions must be met: Exposure Outcome Third variable (Confounder) Be associated with exposure - without being the consequence of exposure Be associated with outcome - independently of exposure Not an intermediary/not on the pathway
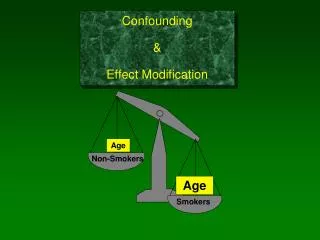
Confounding Grey hair Heart attack Age Age is correlated with heart attack and a risk factor even if there is no grey hair
Confounding ? Heart attack Age Grey hair Grey hair is correlated with age but not a risk factor in young. Is it a confounder?
Confounding Coffee Lung cancer Smoking Smoking is correlated with coffee drinking and a risk factor even for those who do not drink coffee
Confounding ? Smoking Lung cancer Yellow fingers Not related to the outcome Not an independent risk factor Not a confounder
Confounding ? Water source Cholera Pathogens On the causal pathway
How does confounding occur? • Let’s take our example of coffee drinking and lung cancer, and see how it works numerically. • Suppose that a cohort study finds that coffee consumption and is associated with an increased risk of lung cancer; the basic data were as shown below. • What is the risk ratio
Risk in exposed Risk in unexposed • So the risk ratio is given by: 450 / 650 = 1.3 300 / 550
If we now re-analysethe data, grouping the subjects according to smoking habit, we have the table below. • Is smoking a potential confounder?
What are the risk ratios for drinking coffee among people with cancer of the pancreas compared with controls?
Calculate the risk ratio among smokers Risk in exposed Risk in unexposed • So here the calculation is: OR = 400/500 = 1 200/250
Now calculate the risk ratio among non-smokers Risk in exposed Risk in unexposed • So here the calculation is: OR = 50/150 = 1 100/300
Positive and Negative Confounding • In the example we used, the effect of the confounding variable (cigarette smoking) was to cause an apparent association to be observed between an exposure (coffee) and an outcome (lung cancer), when in fact no association existed. • Where the effect of a confounder is to make the observed association between exposure and outcome appear stronger (i.e. to increase the odds ratio) may be called positive confounding
Positive and Negative Confounding • This effect can also work in the opposite direction: confounding can also result in the association between an exposure and an outcome appearing to be weaker than it really is. This is called negative confounding.
Identification of potential confounders • No magic or formulae but; • Think about exposures that are biologically plausible as risk factors for the outcome in question. • Comprehensive literature review to find what exposures have been found to be risk factors in previous studies.
Controlling for confounding • Can be done at study design stage or at the analysis stage; • At the design stage it can be controlled through; • Restriction • Matching • Randomization • At analysis stage • Stratification • Regression modeling
Restriction • Limiting the study population to those with the same level of exposure to the potential confounder. • Advantages; • Simple • No need to measure confounder • Disadvantages • Generalizability lost • Few subjects hence may reduce statistical power
Matching • Mainly done in case controls, cases and controls are selected in such a way that they are similar to each other in terms of a potential confounder • A matched design must be accompanied by a matched analysis • Advantages; • Control of hard to measure confounders • Disadvantage • Recruitment of suitable matches • Have to perform a matched analysis • Cant examine the effect of a variable(s) that have been matched.
Randomization • Usually applicable in interventional studies • Advantage • Controls for known and unknown confounders • Disadvantages • Not doable in observational studies • Ethical limitations • Large number of subjects may be required
Analysis stage • Two main methods • Stratification • Regression modelling
Stratification • An extension of restriction where data is stratified in terms of confounders and analysed separately • We assume that effect of confounder has been removed in each stratum. • Too broad stratum- there may be significant differences in the stratum., too narrow may yield too few individuals • Inaccurate measure of confounder may lead to subjects being assigned to the wrong stratum.