Download
1 / 21
210 likes | 341 Vues
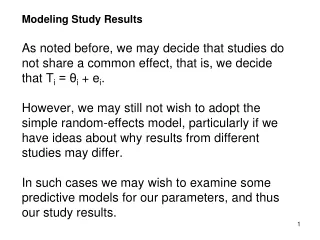
Developing a Mixed Effects Model Using SAS PROC MIXED. Lauren Ackerman Katherine Morgan Rai Oshima. Purpose of the Pilot Study. How accurately can participants identify gender from a handwriting sample? 2. Does accuracy improve with feedback?. Demographic Information. Missing Data!!!.

E N D
Developing a Mixed Effects Model Using SAS PROC MIXED Lauren Ackerman Katherine Morgan Rai Oshima
Purpose of the Pilot Study • How accurately can participants identify gender from a handwriting sample? 2. Does accuracy improve with feedback?
Demographic Information Missing Data!!!
Writing Samples 1. 2. 3. 4. 5. 6.
Why SAS:PROC SGPANEL • Visualize change over time for each subject
PROC SGPLOT proc sgplot data = data_long noautolegend; title 'OLS Trajectories Across Participants'; yaxis min=0 max=50; reg x = time y = score / group = id nomarkers lineattrs = (color = gray pattern = 1 thickness=1); reg x = time y = score / nomarkers lineattrs = (color = red pattern = 1 thickness=3); run; quit;
OLS Assumptions • Normality • Homoscedasticity • Zero Correlation
Modeling Covariance Structure Unstructured Covariance Model Independence Covariance Model Compound Symmetry Covariance Model
Missing Data PROC REG vs. PROC MIXED MAR Missing At Random
proc mixed data = hand_long method=ml; model score = time / solution; run; proc reg data = hand_long; model score = time; run; quit;
Unconditional Growth Model PROC MIXED Output PROC REG Output
Covariances and Correlations Covariances Correlation Matrix
Fixed Effects Model Analysis 2 2 2 2 2 2
Final Model • Model F provided the best deviance statistic • Satisfaction with handwriting and age were the only significant predictors for intercept • No significant predictor for slope besides time
Fit Statistics for Covariance Models Deviance Statistics
Pilot Study Results • How accurately can participants identify gender from a handwriting sample? Baseline 69.91% accuracy; 95% CI (65.60%,74.23%) Time important predictor (Estimate 1.73, p<0.01) 2. Does accuracy improve with feedback? Group not significant (Estimate 0.37, p = 0.79)
Conclusion Why SAS? • Graphical and mixed effects modeling capability Why PROC MIXED? • Allows autocorrelation and homoscedasticity • Flexibility in modeling the within subject variability • Handles missing data • Inclusion of time-varying predictors