Download
1 / 21
210 likes | 379 Vues
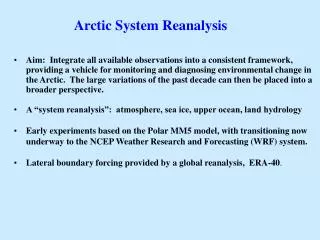
Lars Axell and Per Kållberg Research and Development Swedish Meteorological and Hydrological Institute. An atmosphere-ice-ocean reanalysis of the Arctic for the IPY. Outline. Description of the coupled model system Results from the Arctic reanalysis Conclusions so far Outlook.

E N D
Lars Axell and Per Kållberg Research and Development Swedish Meteorological and Hydrological Institute An atmosphere-ice-ocean reanalysis of the Arcticfor the IPY
Signatur Outline • Description of the coupled model system • Results from the Arctic reanalysis • Conclusions so far • Outlook
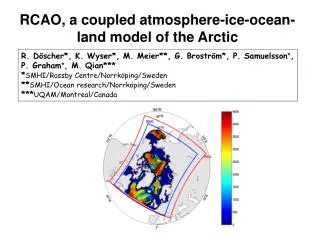
Description of the coupled model system • Atmosphere: • Circulation model: HIRLAM version 7.2 • Data assimilation: 4D-Var 6-hour cycle • Observations: TEMP, PILOT, AIREP, SYNOP, SHIP, AMSU-A over sea and ice – from ECMWF MARS archive • 40 hybrid levels (top at 10 hPa) • lateral boundary conditions – from ERA-interim • Ocean: • Circulation model: HIROMB version 4.1 • Data assimilation: Optimal Interpolation (OI) • Observations: NCEP SST, AMSR-E SIC, S/T profiles (ships, buoys, gliders, moorings, Ice-Tethered Profilers) • 208 z-levels (5-25 m resolution) • Horizontal grid: 306x306, ~12 nm resolution (both HIRLAM and HIROMB) • Rotated coordinate system: South pole at 4ºS, 0ºW (both HIRLAM and HIROMB) model domain and bathymetryof HIROMB Signatur
Signatur Description of the coupled model system(cont.) • Exactly the same horizontal grid as HIRLAM (no separate coupler) • Bathymetry data: • International Bathymetric Chart of the Arctic Ocean (IBCAO) • Regional data from the Baltic Sea • Scripps Institution of Oceanography, UCSD (satellite altimetry and depth soundings) • 47 rivers (annual means) • Open boundaries: • Salinity and temperature from World Ocean Atlas 2005, monthly means • Sea levels: inverse barometer effect
Signatur The coupling • Coupling time step: 6 hours • HIROMB is forced by HIRLAM-fields (winds, air temperature, air pressure, cloudiness, etc.) • HIRLAM reads fields of ice concentration and SST from HIROMB • HIROMB’s analysis after its forecast; HIRLAM’s analysis before its forecast Analyses performed here
Signatur Number of ocean observations (2005-2007) (note the logarithmic scale) temperature salinity
Signatur March 2005 hirlam-hiromb sea ice concentration % era_interim September 2005
Signatur Monthly mean fields March 2005 surface salinity surface temperature September 2005
Signatur monthly mean ocean-air net energy exchange, march 2006 red=downwards, blue=upwards hirlam/hiromb era interim
Signatur monthly mean ocean net energy exchange, september 2006 hirlam-hiromb era interim
Signatur hiromb ice-drift march 2006 hirlam 10-metre wind march 2006
Signatur hiromb ice-drift september 2006 hirlam 10-metre wind september 2006 hiromb ice-drift March 2006 hirlam 10-metre wind March 2006
Signatur hirlam wind-stress march 2006 hirlam wind-stress september 2006
Arctic Sea Ice Extent(reanalysis updated until 200610) • Ice extent = sum of area with at least 15 % sea ice Signatur
Transect across Fram StraitDate: 2005-09-15 (Greenland left) • Northward transport of high-saline, warm water west of Svalbard • Southward transport of low-saline, cold water off Greenland’s shelf • Data assimilation of mooring data (S/T) • Net southward volume transport: 1 Sverdrup (mean 2005) • Net northward heat transport: 10 TW (mean 2005) Velocity (cm/s) Signatur Salinity (psu) Temperature (°C)
Signatur Fluxes through Fram Strait(monthly means) 2005 mean: +9.5 TW 2006 mean: -25.4 TW 2007 mean: ? Volume flux (unit: Sverdrup) Heat flux (unit: TW) (0 deg reference)
Heat budget (fluxes in TW into the Arctic)(proper Arctic except Barents Sea) • Large total differences between 2005 and 2006 • Largest difference in the Fram Strait Signatur
Signatur Changes in total ice volume(proper Arctic except Barents Sea) 2005-04-16 12:00 UTC 2006-04-24 12:00 UTC 2005-09-18 00:00 UTC 2006-09-29 06:00 UTC Change: 8600 km3 Change: 5622 km3 Ice decrease 2005: 5 622 km3 Ice export 2005: 482 km3 (9%) Ice decrease 2006: 8600 km3 Ice export 2006: 377 km3 (4%) ------------------------------------------------------------------------------------------- BE DA FR BS Tot ------------------------------------------------------------------------------------------- 2005 73 102 273 34 482 2006 56 82 241 -2 377 -------------------------------------------------------------------------------------------
Signatur Conclusions • Common horizontal grid – simplifies coupling • 23 months reanalysed so far (Jan. 2005 to Nov. 2006) • Ice decrease in 2005 and 2006 due to regional melting, not ice export • Lateral oceanic heat flows into the Arctic Larger in 2005 than in 2006 • Compared to ERA-interim, our analysis has • consistent air-sea energy exchanges between the ‘spheres’ • more detailed sea ice analyses • an ocean component!
Signatur Outlook • Complete three years, 2005-2007 • Replace HIROMB bulk formulae with HIRLAM fluxes • Re-calculate lateral oceanic budgets (volume, heat, freshwater) • Write a report and a paper END