PVAAS Statewide Core Team Fall, 2011
Pennsylvania Value-Added Assessment System (PVAAS): Effectively Communicate PVAAS with your Board and Community. PVAAS Statewide Core Team Fall, 2011. Session Description.

PVAAS Statewide Core Team Fall, 2011
E N D
Presentation Transcript
Pennsylvania Value-Added Assessment System (PVAAS):Effectively Communicate PVAAS with your Board and Community PVAAS Statewide Core Team Fall, 2011
Session Description This 60 minute session will provide strategies and approaches for discussing PVAAS with your local school board and community, as well as communicating PVAAS results. Approaches that have been used by actual districts in Pennsylvania will be discussed. Materials and resources to use as tools for communication about PVAAS to your local school board and community will be reviewed. Opportunities for questions and discussion will be provided. There are trainer notes included for this presentation.
Agenda Documents & Suggested Handouts to use with School Board Members Considerations for Communicating PVAAS to School Boards and Your Community PVAAS Public Reporting Site Examining the School Board PowerPoint template Questions
Suggested Approach for InitialSession with School Board • Keep it simple…keep it conceptual • Discuss what PVAAS is and is not • Start with a focus on Scatter Plots: Achievement vs. Growth • Summarize important reports! • Suggest starting with Reading and Math only • District Value-Added Report • Value-Added Summary Report (building level results) • District (Single Grade) Projection Summary Report • Performance Diagnostic Summary Report (if needed) Go For The BIG IDEAS!
Suggested Approach for Discussion with Community Members • Keep it simple…keep it conceptual • Discuss what PVAAS is and is not • Start with a focus on Scatter Plots: Achievement vs. Growth (Across Grades Only!) • Summarize important information! • District & School Value-Added • Across Grades Only • School Search • Average Growth Index • Across Grades Only Go For The BIG IDEAS!
Supports and Resources to Prepare & Present atPVAAS to School Board Members and/or Community
Show: DVD for School Boards PVAAS for School Board Members by School Board Members • Tom Gentzel, PSBA • 2 Superintendents • School Board Members • 12 minutes • Email pdepvaas@iu13.org for a copy of the DVD
Suggested Resources & Documents for Board Members • Copy of PPT Presentation • Guides to PVAAS Reporting 2011 • Guide to PVAAS Reporting for LEAS 2011 • Guide to PVAAS Public Reporting 2011
Suggested Resources & Documents for Board Members • Copies of Key District Reports • District Value-Added Summary Reports • District Value-Added Reports • District Projection Summary Reports • District Scatter Plots • Web-based Scatter Plots (demonstrate on public reporting site) • Grade level or Across Grades
PDE PVAAS Webpage Help Menus, PPT Presentationswith Trainer Notes, Resource Materials, Video Clips, & District Case Studies
SAS PVAAS Website New & Archived Webinars, Podcasts, Guide to PVAAS Reporting for LEAs, Guide to PVAAS Public Reporting, & Intermediate Unit Supports https://pvaas.sas.com
Key Concepts: ANY PVAAS Session Achievement Progress • Measures students’ performance at a single point in time • Compares student performance to a standard • Critical to students’ post-secondary opportunities • Highly correlated with demographic factors, such as socioeconomic status • Measures students’ progress across time/years • Compares student performance to his/her own prior performance • Critical to ensuring students’ future academic success • Not correlated with demographic factors
Key Concept:ANY PVAAS Session • PVAAS reporting reflects the effectiveness of your district’s or school’s Standards-Aligned System • PVAAS reporting reflects the district’s or school’s system regarding curriculum, assessment, and instruction
Key Concepts: ANY PVAAS Session • There is NO relationship between demographic variables such as socioeconomic status and growth. • There are high achieving schools making high growth; • There are high achieving schools making low growth; • There are low achieving schools making high growth; • There are low achieving schools making low growth. • Growth reporting reflects what WE do with students in terms of academic growth in schools/districts. • -- VAAS can remove the effects of factors not under the control of the school. (McCaffrey, Lockwood, Koretz & Hamilton, 2003; Ross, Wang, Sanders, Wright & Stringfield, 1999a; Wright, Horn & Sanders, 1997).
Key Concept:ANY PVAAS Session • PVAAS District and School Value-Added Reports do NOT provide a measure of teacher effectiveness! • Often people ask about the meaning of these reports, especially in situations where there is only one classroom teacher in a grade level. This is NOT a report on the effectiveness of the classroom teacher, even in that situation! • Teacher effectiveness reporting would be done using a different statistical analyses than the one used for reporting on district or school effectiveness. Additional data would be collected as well.
Who? - What? -When? - How? Decision Points
Decision Point: Audience • What are the backgrounds of school board members? • Do the board members have experience with growth data/PVAAS? • Do the board members have any background knowledge/foundation in Statistics?
Decision Point: Intended Goal for Session (s) • PVAAS Overview? • Review of Actual District/School Data? • Part of Planning Process? • Comprehensive Planning • School Improvement Planning
Decision Point: Focus of Data • District? • School? • Grade? • Subgroups? • Which subjects? • Math, Reading, Science, Writing • Remember, less is more!
Decision Point: Reports Needed District-wide Focus • Scatter Plots • District Value-Added • Think ahead if there is only one building per grade • Value-Added Summary/Individual schools • District (Single Grade) Projection Summary Reports • (Optional) Performance Diagnostic Summary • If your audience is interested in growth of students at different achievement levels
Talking About Your Results Think about your message before sharing your results! • What do the results mean? • Do you have a plan of action regarding the areas needing improvement (Yellow and Red)? • What is your plan of action for attending to the Green, Light Blue, and Dark Blue areas?
Talking About Your Results Think about your message before sharing your results! • What do the results mean? • Do you have a plan of action regarding the areas needing improvement (Yellow and Red)? • What is your plan of action for attending to the Green, Light Blue, and Dark Blue areas?
Decision Point: Session Facilitators(s) • Principal • Team of Principals • District Administrator(s) • District Administrator(s) + Principal(s) • Support from Intermediate Unit PVAAS Contacts • PVAAS Statewide Team for PDE • Regional sessions for district administrators and School Board members
PVAAS Projections are an Approved Way for Schools to Make AYP(Growth Model)
PVAAS Public Reporting Site • Value-Added (Growth) Reports at District and School Levels • Math, Reading, Science, and Writing • Grades 4 through 8, and 9-11 • School Search Capability • Allows users to find and view the achievement and progress of groups of students in public schools across the Commonwealth of Pennsylvania. • Can search for similar schools based on grade levels tested and various demographics. • Web-based scatter plots
Preparing for Parent Requests • Parents may ask about data or students. • What is available at the student level? Projections! • Percent likelihood of a student reaching Basic, Proficient and/or Advanced levels on future PSSA • Some PA districts have shared PVAAS student projections with parents. • Plan in advance for how to respond such requests
Questions?Comments?Email pdepvaas@iu13.org for a PowerPoint version of this session.
Presenting PVAAS to an Individual School Board Power Point Templatewith Trainer Notes
Pennsylvania Value-Added Assessment System (PVAAS):A Compass for Improvement Presented at [District] School Board Meeting [Date]
DVD for School Boards PVAAS for School Board Members by School Board Members • Tom Gentzel, PSBA • 2 Superintendents • School Board Members • 12 minutes
TWO Types of PVAAS Information Looking Forward/Planning… PVAAS Projection Reports For Individual Students and Groups of Students Looking Back/Evaluation… Value-added Growth Reports For Groups of Students Today
PVAASIS: • Analysis of existing assessment data • Longitudinal PSSA scores in available content areas • Math, Reading, Science, Writing • Provides reliable estimates • A measure of a school’s effectiveness • Critical Relationship: Growth Data vs. Achievement Data
PVAAS: • Is not another test Critical concept • Is not a comparison of single test scores
Review of Literature Is there a relationship between… • Demographics vs. Achievement? YES • Demographics vs. Growth? NO Demographics are inherently controlled for in PVAAS due to the use of all longitudinal data on students!
Current Data Collection Approaches High Achievement Average Achievement Low Achievement Achievement is based on each student’s ending point.
PVAAS Adds Another Variable To Achievement…GROWTH! Below Growth Standard At or Above Growth Standard Growth is based on each student’s starting point!!
Viewing Achievement and Progress Together PVAAS Web-based Scatter Plots
Scatter Plot Quadrants and Their Meanings Quad 2 - Slipping Higher Achievement Lower Growth Quad 1 - Excelling Higher Achievement Higher Growth Quad 4 - Improving Lower Achievement Higher Growth Quad 3 - Underperforming Lower Achievement Lower Growth
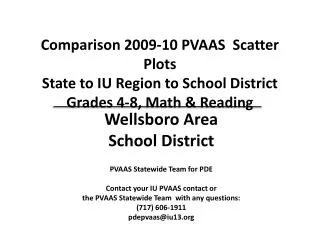
Example: Regional Scatter Plot: Same Schools, Different Subject
District Scatter Plots Math and Reading