Download
1 / 36
370 likes | 396 Vues
Learn about TMA, DMA, DSC, TGA, and DTG to determine thermal properties of textiles as a function of temperature. Study weight loss due to decomposition and more.

E N D
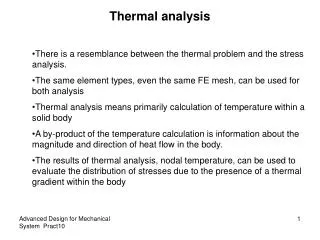
THERMAL CHARACTERIZATION OF TEXTILE MATERIALSThermal Analysis A group of methods by which the physical & chemical properties of a substance, mixture &/or reaction mixtures are determined as a function of temperature and/or time, while sample is subjected to a controlled temperature program. Include heating or cooling (dynamic) or holding temperature constant (isothermal), or combination.
Different Techniques • Thermal Mechanical Analysis (TMA) • Thermal Expansion Coefficient • Dynamic Mechanical Analysis (DMA) • Viscoelastic Properties • Differential Scanning Calorimetric (DSC) • Heat flow during Transitions • Thermal Gravimetric Analysis (TGA) • Weight Loss due to decomposition • Derivative Thermogravimetric Analysis (DTG) • Differential Thermal Analysis (DTA) • Heat of Transitions
Thermogravimetric Analysis (TGA) • Used to measure changes in weight (mass), m, of sample as a function of T and/or time. • Commonly used to • Determine polymer degradation temperature, • Residual solvent level, • Absorbed moisture content, and amount of inorganic (noncombustible) filler in polymer or composite material compositions. • Decomposition kinetics of material.
Thermogravimetric Analysis Sample is placed into a tared TGA sample pan which is attached to a sensitive microbalance assembly. Sample holder is then placed into high temperature furnace. Balance assembly weigh the initial sample at room T & then continuously monitors changes in sample weight (losses or gains) as heat is applied to sample. Heat applied at certain rate, in various environment. Typical environment: ambient air, vacuum, inert gas, oxidizing/reducing gases, corrosive gases, carburizing gases, vapors of liquids or "self-generating atmosphere". The pressure can range from high vacuum or controlled vacuum, through ambient, to elevated and high pressure; the latter is hardly practical due to strong disturbances.
Thermogravimetric Analysis (TGA) Typical weight loss profiles are analyzed for the amount or % of weight loss at any given temperature, amount or % of noncombusted residue at final temperature, & temperature of various sample degradation processes.
No decomposition with loss of volatile products. • Rapid initial mass loss characteristic of desorption or drying. • decomposition in single stage. • multi-stage decomposition. • multi-stage decomposition but no stable intermediates. • Gain in mass as a result of sample reaction. • reaction product decompose again.
Applications of TGA • Helps to understand thermal decomposition kinetics of material. • Used to determine water content. • Allows analysis of reactions with air, oxygen, or other reactive gases. • Can be used to measure evaporation rates, such as to measure the volatile emissions of liquid mixtures. • Allows determination of Curie temperatures of magnetic transitions by measuring the temperature at which the force exerted by a nearby magnet disappears on heating or reappears on cooling. • Helps to identify plastics and organic materials by measuring the temperature of bond scissions in inert atmospheres or of oxidation in air or oxygen. • Used to measure the weight of fiberglass and inorganic fill materials in plastics, laminates, paints, primers, and composite materials by burning off the polymer resin. The fill material can then be identified by XPS and/or microscopy. The fill material may be carbon black, TiO2, CaCO3, MgCO3, Al2O3, Al(OH)3, Mg(OH)2, talc, Kaolin clay, or silica, etc.
Differential Scanning Calorimetry (DSC) A thermal analysis technique in which the amount of energy absorbed (endothermic) or released (exothermic) by a material is measured. Both events are the result of physical and/or chemical changes in a material. Normally the weight of sample is 5 – 10 mg, Sample can be in solid or liquid form. Many of the physical (e.g evaporation) or chemical (e.g decomposition) transformation are associated with heat absorption (endothermic) or heat liberation (exothermic).
Differential Scanning Calorimetry (DSC) 2 pans sit on a pair of identically positioned platforms connected to a furnace by common controlled heat. Record any energy difference – endothermic or exothermic depending on whether more or less energy has to be supplied to the sample relative to the reference material. Endothermic response usually represented positive, opposite of usual DTA convention (endothermic as negative side) Correlate endothermic or exothermic peaks with thermal events in sample. One way – test if readily reversible on cooling & reheating. Exothermic process usually not, unlike melting & many solid-solid transitions.
Differential Scanning Calorimetry (DSC) Computer makes sure that the 2 separate pans heat at the same rate (usually 10°C/min or lower) as each other. Depending on endothermic or exothermic events, results in more or less energy has to be supplied to the sample.
Typical DSC curve for polymer (especially thermoplastic), for polymers that don’t crystallize (amorphous), Tc & Tm will not present. • Comparing Tg with Tc & Tm, Tg only involve changes in heat capacity.
Estimation of Crystallinity of Polymer • The area under a melting transition curve is the total amount of heat absorbed during the melting process. • This area is used below to calculate the fraction crystallinity that existed before the polymer was heated. • ∆Hf is the enthalpy of fusion and is defined as the calories required to melt one gram of crystal. • ∆Hexp is experimental data and it is the calories required to melt one gram of sample.
% of crystallinity calculated relative to 100% crystal material’s Tm peak.
DSC – Applications Identify melting point, glass transition, energy required to melt material. Evaluation of phase transformation. Decomposition, polymerization, gelation, curing. Determination of crystallization temperature upon cooling. Estimation of Crystallinity of polymer. Evaluation of processing, thermal & mechanical histories. Process modeling, material’s minimum process temperature (processing condition). Perform oxidative stability testing (OIT). Compare additive effects on material.
Differential Thermal Analysis (DTA) Record temperature difference between sample & reference material. If endothermic event (e.g melting) temperature sample will lower than reference material. If exothermic event (e.g oxidation) response will be in opposite direction. Reference material: Thermally stable at a certain temperature range Not react with sample holder or thermocouple Heat capacity should be similar to those of sample Both solid sample & reference materials are usually in powdered form. DSC which measures temperature differnce between sample and reference are not true DSC; they are called DTA. DTA are developed by many manufacturers to avoid patent protection of DSC mode of operations. DTA is simpler than DSC.
THERMO-MECHANICAL ANALYSIS (TMA) • Thermal dilatometry is a technique in which the dimension of a sample is monitored against time or temperature. • Two types of dilatometry is commonly used: Volume dilatometry and length dilatometry. • The length dilatomery used a Thermo-mechanical analyzer (TMA) where sample length is measured as a function of temperature or time where sample is hold under a small and compressive force. • Experimental technique • Specimen: All types of solid – powders, films, fibers, molded pieces, etc. • Use of probe resting on sample under a positive load. As sample is heated, cooled or held isothermally, dimensional changes in sample is translated into linear displacement of probe.
Probe configuration TMA : (a) penetration & (b) extension. LVDT – linear variable differential transformer. Also use other types of transducer – laser, optoelectronic.
Probe configuration TMA : (c) flexure & (d) torsional measurement. Dimensional changes are monitored and transducer transform responses into electrical signal (output).
Measurement of Tg of epoxy PCB – probe rest on surface under low load. As sample expands during heating, probe is pushed up & resulting expansion of sample is measured. At Tg, epoxy matrix exhibits significant change in slope due to an increase in its rate of expansion. Onset T of this expansion = Tg.
As the space between the chains increases, the chain can move. Physical aging Tg Tg in polymer corresponds to the expansion of free volume allowing greater chain mobility above this transition.
TMA penetration probe – during measurement, loading is added so probe moves down through sample as it softens. Useful for measuring Tg of coatings on substrate. TMA of wire sample with 2 coatings – inner coating prevents electrical contact between adjacent wires and outer coating used to bond the coil.
TMA penetration results on crosslinked and non-crosslinkedpolyethylenes. Crosslinked sample exhibits smaller degree of penetration due to higher viscosity in liquid region above Tm. • High sensitivity of TMA technique allows it to detect weak transitions.
Thermo-Mechanical Analysis (TMA) • Application : • Determine coefficient of thermal expansion (α, β, ϒ ) of material. • Identify Tg & Tm of material. • Composite delamination temperature.
Dynamic Mechanical Analysis (DMA) In elastic system – work stored as potential energy. In viscous system, all work done by system dissipated as heat. Polymer dual nature, i.e viscous-elastic. DMA – info on dynamic properties relating to these two behaviors. Gives these two properties as a function of time, temperature or frequency: elastic modulus, ω’ – energy stored (dynamic storage modulus). viscous modulus, ω’’ – ability to dissipate energy as heat (dynamic loss modulus). Thus, stiffness & its dampening capacity.
Dynamic Mechanical Analysis (DMA) Dynamic Mechanical Analysis (DMA) is a technique in which the elastic and viscous response of a sample under oscillating load, are monitored against temperature, time or frequency. The modern DMA systems are nearly always fixed frequency systems operating at frequencies between about 0.01 and 100 Hz. Temperature region is ranging from about – 150ºC to 300ºC. In DMA, instead of keeping the strain constant, as in a stress relaxation test, the strain is oscillated at constant amplitude, ε0, and a constant frequency, ω. the strain input is ε(t) = ε0sin ωt. Stress will respond at the same frequency but may have a phase difference and different amplitude. The stress will be given by σ(t) = σ0 sin(ωt + δ) = G(ω) ε0 sin(ωt + δ) where, G(ω) is the dynamic modulus, and δ is the phase angle.
The dynamic modulus G(ω) is the ratio of stress to strain; in this case we take the ratio of the amplitudes of the stress and the strain: • G(ω) or the dynamic modulus defines the modulus of a viscoelastic material. • The phase angle (δ), describes the viscous character of the material. • If δ = 0, the stress is in phase with the strain and the material is totally elastic. • If δ = π/2, the stress is completely out of phase and is completely viscous. • In general, δ will be between 0 and π/2 and the material will be viscoelastic. • In alternative representations, we can expand the stress function: • σ(t) = G(ω)ε0cos δ sin ωt + G(ω)ε0sin δ cosωt • = G’(ω)ε0sin ωt + G”(ω)ε0cos ωt • Where, G’(ω) = G(ω) cos δ and G”(ω) = G(ω) sin δ • G’(ω) is known as the storage modulus. • G”(ω) is known as the loss modulus
The storage modulus G’(ω) is proportional to that part of the strain energy that is stored and then recovered during one cycle. It also describes the elastic part of the stress response, or the part of the stress in phase with the strain. • The loss modulus G”(ω) is proportional to that part of the strain energy that is lost during a cycle due to viscoelastic dampening. It also describes the viscoelastic part of the stress response, or that part of the stress that is out of phase with the strain. Complex modulus is defined as
Sample is fixed between 2 parallel arms that are set into oscillation by an electromagnetic driver at an amplitude selected by operator. DMA module measure changes in viscoelastic properties of materials resulting from changes in Temperature, amplitude and time. It then detects changes in the system’s resonant frequency and supplies the electrical energy needed to maintain the preset amplitude. Principle • Samples – fibers, films, molded sheets, powder. • Frequency of oscillation is a measure of modulus of the material. The amount of electrical energy needed to maintain constant amplitude damping properties.
DMA – sample subjected to sinusoidally varying strain of angular frequency. • For viscoelastic material, resulting stress will also be sinusoidal, but will be out of phase with the applied stress owing to energy dissipation as heat, or damping. • Damping can be calculated by • h = (v2 – v1)/vr, or measure driving force to maintain constant amplitude.
Typical DMA characteristic of a semi-crystalline polymer as a function of temperature is plotted • Below Tg, G’(ω) is fairly constant. • At Tg, G’(ω) drops dramatically, while, tan δ goes through a peak. • Peaks in tan δ can also be observed below Tg:sub-glass relaxations.
Figure shows DMA results of some polymers. It can be seen how polymer structure influences its viscoelastic behavior. A - linear amorphous polymers. B - crosslinked polymers. C - semicrystalline polymers. D & E - poly(ester urethane)s.
Applications • Examine viscoelastic behavior of material as a function of stress, strain, frequency, time & temperatures. • Measurement of modulus vs temperature. • Examination of additive (filler, plasticizer) & cure time effects on viscoelastic properties & Tg. • Study of mechanical behavior. • Quantification of impact properties / toughness of composite materials.