North American Pulp & Paper Industry
480 likes | 748 Vues
North American Pulp & Paper Industry. Impacts of High & Volatile Energy Costs on Energy Intensive Industries ~ Coping Strategies and Future Research Needs ~ ~ April 9-10 ~ 2008 ~ Morgantown, West Virginia Center for Paper Business and Industry Studies (CPBIS)

North American Pulp & Paper Industry
E N D
Presentation Transcript
North American Pulp & Paper Industry Impacts of High & Volatile Energy Costs on Energy Intensive Industries ~ Coping Strategies and Future Research Needs ~ ~ April 9-10 ~ 2008 ~ Morgantown, West Virginia Center for Paper Business and Industry Studies (CPBIS) Dr. Jacquelyn-Danielle McNutt ~ Executive Director
Overview Industry Context Energy Use Areas Critical Competitiveness Issues Impacts of High & Volatile Energy Costs Coping Strategies Outlook/ Recommendations For Future Research Energy Consumption Data Key Raw Materials Support Data
Industry Context Key Industry Attributes ~ • A major playerin US and global economy • Mature, commodity, consolidating industry ~ slow growth • Enjoys significant fiber resources & logistics system . . . • NA sector world’s largest ~ supply & demand ~ with superb to the market infrastructure • Major consumer of fiber, energy and water . . . • Industry performance has had a 30 year hic up
30 Year Financial Performance Returns on Book Value of Total Capital ~ ROTC Has Equaled COC Twice Since 1975
30 Year Financial Performance Book Value of Debt ~ Risen vs. Investment ~ A Product of Lagging ROTC Versus COC
Industry Production & Consumption Volume Off 3-4% from 1999 Peak ~ Yet Absolute Volume Still Large & Has Rebounded Some From First Post WW II Major Decline
Industry Context Current Performance Improvement Issues ~ • Competitiveness presently boosted by weak US dollar ~ but dealing with aging asset base. . • And ~capacity is finally being consolidated & managed to the market • As such ~ currently enjoying a moderate upturn ~ pricing, returns, investments & shareholder returns • Key question ~ how long will this modest upturn last? • The US and Global Economies & Energy Issues
Industry Context Assets’ Issues ~ • A new mill hasn’t been built in last 17 years + • Even with zoning, environmental & regulatory clearances ~ cost would be economically prohibitive for major players = aging asset base • 10 Years ago ~ the copy paper market was a free-for-all ~ with10 ~ 14 major producersslugging it out • Today ~ three firms control 70% of this market = major consolidation & assets’ management
Assets’ Age ~ Crucial For Future Changes NA Producers Have Improved Asset Quality ThroughIncremental Investment & Closure of Uncompetitive Lines Past Few Years ~ But Future Improvements Will Still Be On An Older Asset Base North American Paper Machine Lines
Industry Context Cautions ~ • Industry is Susceptable to ~ • Substantial substitution by other materials • Offshoring of production • Offshoring of end users products • The global & US economies • Rapidly changing energy situation • Not learning from history . . .
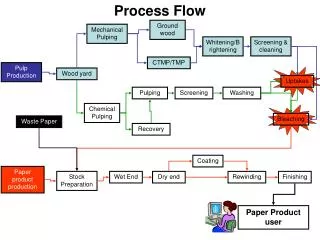
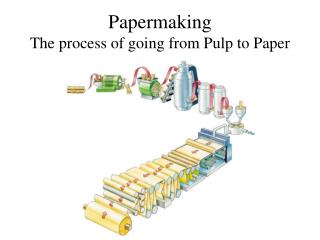
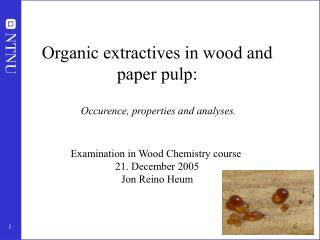
Paper Industry Energy Use Areas The Paper Industry Has Broad Array of Energy Uses ~ • Plant/ grow/ harvest/ transport trees to mills • Process trees into chips to transform them into “fiber pulp” • Called digesting ~ in high heat/ pressure digesters • Process/ recover lignin/ chemical wastes from digesting process via black liquor recovery boiler • Which provides about 50% of energy for the mill but still very inefficient as they have to be fired by natural gas or pulverized coal in very high temp pressure fluidized bed systems) • Manufacture of the paper products themselves • Convert the paper to end products in the right sizes and shapes for sale and distribution • Distribute/ transport finished products to the market
2,500 MECS 2,000 1,500 BAT TBtu 1,000 Practical 500 Minimum Theoretical 0 Minimum Paper Pulping Powerhouse Misc. & Total Manufacture Environmental Energy Use by Applying Technologies
Critical Competitiveness Issues Facing Industrial Manufacturing Industries • In US raw materials are available and US has the infrastructure to get at them (general knowledge of industry) (GNI) • However US tax laws promote slow depreciation which leads to slow replacement upgrades. • FPI equipment is old with the last Kraft mill in 1990 • Last newsprint machine was 25 years ago • Because the US has had large & growing market, oversees sales and competitiveness skills not well developed • Largest issue is the bulk of current FPI management is focused on “managing decline” • That does not get the attention of financial investors and does not prepare the organization to win
Impacts Of High And Volatile Energy Costs • Energy in US is still cheaper than in most industrialized nations • Higher energy prices might help the Forest Products Industry’s (FPI) relative competitive position (RCP) • Prices for liquids & gas are very likely to rise faster than inflation so any RCP is likely to get better (Federal Energy Council Report) • While US pulp and paper industry is energy intensive ~ • It generates 60 % of energy used from biomass ~ mainly Black Liquor and bark • Therefore the energy impact is lower • Just as important as liquid prices is price volatility • Much of the FPI industry is on some natural, gas because mills were built cheap & gas boilers are the cheapest of all • Gas also varies with season while pricing has a more gradual change.
Coping Strategies • To cope with volatility mills install multi fuel capability • In 2007 there were 11 mills now using pet coke as fuel for lime kilns • To cope with costs mills have more emphasis on energy reduction efforts • DOE report indicates that an average mill can reduce energy consumption by 25% • One excellent example is the Focus on Energy program for all industries in Wisconsin • Leads mills to consider adding biorefinery capability (NewPage, Wisconsin Rapids)
Sector Outlook And Recommendations For Future Research Studies • Sector outlook is for “change” ~ • More consolidation, more assets’ rationalization, and for more ownership by private equity firms + substantial structural changes • More developments of/ in foreign markets • Some biorefineries now and more later ~ perhaps after even more shutdowns • Biorefineries will add decades of life to mills • Increased research on how to make/ create • Enhanced energy use efficiencies; • Energy more cost effectively and more profitable chemicals ~ all from biofuel building blocks • Better energy and chemical markets understandings & connections + logistics across entire supply chain
Change is one thing, progress is another. "Change" is scientific; "progress“ is ethical; change is indisputable, whereas progress is a matter of controversy -- Bertrand Russell – 1950 For Energy Consumption Change ~ we need sustained change now, not simply incremental progress . . .
Contact Information www.cpbis@gatech.edu Dr. Jacquelyn-Danielle McNutt Executive Director ~ Center for Paper Business & Industry Studies 404-894-5733 ~ jacquelyn.mcnutt@cpbis.gatech.edu Energy Consumption Data Source Mr. Bob Kinstrey Jacobs Engineering 864-676-5664 ~bob.kinstrey@jacobs.com Assessment Support Input Mr. Benjamin A. Thorp Richmond, VA 804-873-6561 ~bathorp@concast.net
Pulp and Paper Industry Energy Consumption Support Data
Major Energy Users by AreaWithin the Pulp and Paper Manufacturing
600 500 Paper Drying Paper Machine Wet End 400 Liquor Evaporation TBtu 300 Pulping Chemical Prep 200 Wood Cooking Bleaching 100 0 MECS BAT TBtu TBtu Comparison of Major Energy Areas 480 355
Key Raw Materials Support Data Pulpwood Recovered Paper Oil Natural Gas Forests
Pulpwood US Pulpwood Prices ~ Upward Pressure & Increased Marginally 2007/08 ~ But Remain Low By Historic Standards
Recovered Fiber Recovered Fiber Prices ~ Rising With Export Demand & Higher Domestic Consumption
Oil $90+ Bbl Oil Puts Cost Pressure on Manufacturers ~ But Dissuades Use of Plastic Packaging ~ Stimulating Biofuels . . .
Natural Gas $7+ per MCF Natural Gas Down From 2005 Peaks But Remains High By Historic Standards ~ Still High Enough to Stimulate Biofuels
Forests Forests Are A Key Global and National Resource With Much Untapped Potential USA’s Forests Global Forests
U.S. and Southern Forest Area, 1630-1997 Forest Resources of the U.S., Table 2
Commercial Timberland Area in the U.S.by Region (million acres) 504 MM ac; 201 S; 159 N; 71 M; 72 W Forest Resources of the U.S., Table 9
Softwood Growing Stock Inventoryby Region 484 Billion cu ft; 105 S; 49 N; 114 M; 215 W Forest Resources of the U.S., RPA, Table 17
Annual Removals of Softwood Growing Stock Volume by Region 10.1 Billion cu ft; 6.5 S; 0.7 N; 0.5 M; 2.4 W Forest Resources of the U.S., RPA, Table 35
Hardwood Growing Stock Inventory by Region 351Billion cu ft; 151S; 165 N; 11 M; 24 W Forest Resources of the U.S., RPA, Table 17
Annual Removals of Hardwood Growing Stock Volume by Region 5.96 Billion cu ft; 3.7S; 2.1 N; 0.0 M; 0.1 W Forest Resources of the U.S., RPA, Table 35
U.S. Pulp Wood Fiber Supply, Historical and Projected Potential RPA Timber Assessment, Table 3-1
Average Annual Growth Per Acreby Owner Group, 1962-1996 Forest Resources of the U.S., Figure 31
Global Forests –Growing Stock & Harvest Levels • Growing Stock (390-400 billion m3): • Softwood = 33% of growing stock ~Russia = 50% & North America = 30% • Hardwood = 67% of growing stock ~Tropical forests in S. Am, Africa & Asia = 80% • Industrial Roundwood Harvest (1.8 billion m3): • Softwood/hardwood Mix Is ~63% To 37% • N. Am. provides 40% of total industrial softwood supply from ~ 14% of growing stock • Fuelwood Is Nearly 55% ofTotal Harvest of 3.7 Billion m3~ Asia/Africa/Latin America = 80%
63.7 22.6 13.0 7.5 6.8 16.9 12.7 9.5 1.8 1.1 4.9 4.9 107.4 37.1 55.1 3.8 7.9 0.9 0.5 2.0 Softwood: 125 Hardwood: 255 World Forests’ Growing Stock billion m3 Europe Canada Japan United States Russia China SoutheastAsia Africa Australia/New Zealand South America
Land Area RequirementsFast-growing trees and short harvest times result in significantly less land area required to support a world class paper mill Brazil Indonesia U.S. South
Global Forests & Carbon • Forests ~ are a vital carbon sink • Whereas deforestation, degradation and poor forest management reduce carbon storage in forests ~ sustainable management, planting, and rehabilitation of forests increase carbon sequestration. • The world’s forests store285 Gigatonnes (Gt) of carbonin their biomass alone. • The carbon stored in forest biomass, deadwood, litter and soil together is ~roughly 50 percent more than the amount of carbon in the atmosphere.
Forests & Carbon • Carbon in forest biomass decreased in Africa, Asia and South America in the period 1990–2005, but increased in all other regions. • For the world as a whole ~ carbon stocks in forest biomass decreased by 1.1Gt of carbon annually ~ • Owing to continued deforestation and forest degradation partly offset by forest expansion (including planting) and an increase in growing stock per hectare in some regions.
Forests & Carbon • Carbon Forest disturbances can be devastating • On average 100+ million hectares of forests are reported to be significantly affected each year by ~ forest fire, pests (including insects and diseases) or climatic events such as drought, wind, snow, ice and floods • However ~ the area of forest affected by disturbances is severely underreported ~ with information missing from many countries, especially for forest fires in Africa