Download
1 / 21
210 likes | 320 Vues
Learn about detecting item degradation concerning psychometric, technical, and utility aspects. Discover methods like statistical process control and Conditional CUSUM.

E N D
Detection of Item Degradation Yongwei Yang Abdullah Ferdous Tzu-Yun Chin University of Nebraska-Lincoln In T. L. Hayes (chair), Item degradation: impact, detection, and mitigation, an academic-practitioner collaborative forum conducted at the 22nd annual conference of the Society of Industrial and Organizational Psychology in New York City, NY, April 2007.
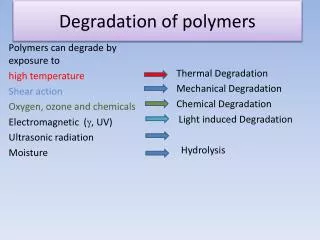
Item Degradation • Item Degradation • Item’s favorable psychometric characteristics deteriorate over time • Psychometric characteristics • Content relevance and representativeness • Technical characteristics (e.g., “difficulty”/“location”, lack of bias) • Utility (e.g., item-criterion relationship) • Item Degradation vs. Exposure/Compromise • Item degradation: observed phenomenon • Item exposure/compromise: • Items have become known to test takers prior to administration • Possible reasons for degradation
Detection of Item Degradation • Essentially it is about investigating the comparability of item’s psychometric properties over time • “temporal stability of the psychometric characteristics” (Chan, Drasgow, & Sawin, 1999) • Can be evaluated under the framework of: • Measurement invariance (MI; Meredith, 1993) • Predictive invariance (PI; Millsap, 1995)
Item Degradation as MI or PI Let x be observed indicator that measures latent w and predicts y, and v be some population indicator • Measurement Invariance (MI) • Same relationship across populations between observed indicators and the latent variables • Degradation noninvariance in such relationships over time • Loading, location • Predictive Invariance (PI) • Same relationship across populations between predictors and criterion • Degradation noninvariance in such relationships over time • Indicator-criterion relationship
Item Degradation Detection Methods • Differential item functioning, item parameter drift • Mean & covariance modeling • Assessing invariance in various aspects pertain to measurement or predictive properties • Statistical process control • Models of change
Item Degradation Detection • Differential item functioning, item parameter drift • Mean & covariance modeling • Assessing invariance in various aspects pertain measurement or predictive properties • Statistical process control • Cumulative sum (CUSUM) procedure • Models of change
CUSUM for Item Degradation Detection • Our approach—Conditional CUSUM • Whether item parameters have deviated from target • Make use of observed scores • The importance of controlling for shifts in traits level over time • “Conditional”—test takers at different time points were matched based on their total test score • Procedures • Initial Item Calibration • Compute target item parameter (e.g., difficulty) using the first n job applicants from the operation sample • Define “time group” • Every m applicants from the n+1 applicant to the last person under investigation • Define “trait group” (conditioning variable) • Divide job applicants into groups of reasonable size based on total test scores • Compute and plot CUSUM statistics for each trait group separately
Time Group i Item Mean Target Item Mean Time Group i Item Variance Initial Status Item Variance Conditional CUSUM—Calculation • Two-sided Standardized CUSUM • Reference value (k) and Control limit (h)
Conditional CUSUM—Data Source • A web-based personnel selection assessment for selecting managers • 103 items measuring job-related non-cognitive attributes • CTT-based test construction and scoring • Fixed-length, linear test • Unproctored • Sample: • Job applicants from Oct. 2002 to Sept. 2005 • Re-taker excluded • Total N = 7,000
Conditional CUSUM—Results • Among the 103 items • 36 flagged for upward shift in item means for at least one trait group • 20 flagged for downward shift in item means for at least one trait group • 9 flagged for having both upward and downward shifts for different trait groups • 38 not flagged for any trait group • A couple examples: it035, it174 • Follow-up analysis: • Were there differences across item types with respect to the likelihood of being flagged by conditional CUSUM?
Conditional CUSUM—Follow-up • Multinomial logistic regression • DV: condition CUSUM flag; 3 categories; “Not Flagged” as the reference category • IV: ability (6 levels), item type (3 levels, multiple choice (MC) as the reference group • Results • GOF statistic indicates appropriate fit of the main effect model (X2=16.83, df=20, p=.664) • The impact of ability levels on the CUSUM flags was not statistically significant (X2=13.48, df=10, p=.198) • The impact of item type on the CUSUM flags was statistically significant (X2=17.83, df=4, p=.001). • MC items were more likely to be flagged by conditional CUSUM for negative shifts • Forward items were more likely to be flagged by conditional CUSUM for positive shifts
Model of Change • Perspective 1: • Understanding patterns of change using examinee characteristics • Do the trajectories of item parameter change vary across different types of examinees? • Applicant location, SES, demographics, etc. • Perspective 2: • Understanding patterns of change using item characteristics • Do the trajectories of item parameter change vary across different types of items? • Item format, complexity, content area, etc. • Formulating these questions in a longitudinal analysis framework
Perspective 1 Example • Using a 2-level longitudinal model to explore: • RQ1: On average, was there a shift in item difficulty? • RQ2: Were there variations in the slope of the shift? • (If Yes to RQ2) RQ3: Could the variations be explained by job applicants characteristics (e.g., trait level, region, etc.)? • The model: • Analysis with item 174: • RQ1: significant positive slope • RQ2: non-significant variations • RQ3: not pursued Level I: Level II:
Perspective 2 Example • Using a 2-level longitudinal model to explore: • RQ1: Across items, on average was there a change in item difficulty over time? • RQ2: Were there variations in the slope of the change across items? • (If Yes to RQ2) RQ3: Could the variations be explained by item characteristics?
Perspective 2 Example • Model A: • Analysis with this data set: • RQ1: average slope across items was not different from zero • RQ2: significant variations in slopes across items • Model B: • Analysis with this data set: • RQ3: item type did not explain a significant portion of the variations in slopes Level I Level II
Summary and Discussions • Two types of methods that serve different purposes: • Statistical process control (e.g., CUSUM): • Real-time monitoring of degradation • We illustrated conditional CUSUM procedure, but other methods exist (e.g., an IRT-based moving residual approach by Han & Hambleton [2004]) • Explicit modeling of patterns of degradation: • Understanding the nature of degradation, exploring potential factors that impact degradation, assisting the development of prevention and mitigation procedures • We illustrated longitudinal modeling methods, but various methods for studying MI/PI may be applied • These methods can also be used in monitoring and understanding degradation in other parameters (e.g., item variance, discrimination, response time) • It might be helpful to monitor/model multiple parameters simultaneously to (1) “flag” items more accurately and, (2) understand factors behind degradation
Summary and Discussions • Understanding temporal stability of measurement properties is essential to: • Valid decisions based on test scores • Valid inferences in substantive research based on assessment outcomes • Research on Flynn effect (e.g., Wicherts et al., 2004) • Further research is needed, such as • What monitoring approaches would better fit personnel selection assessment programs? • What would lead to or impact degradation? • How would item-level degradation impact test-level decisions and inferences? • Etc.
Some Useful References • MI & PI Concepts • Mellenbergh (1989) • Meredith (1993) • Millsap (1995) • Various IPD and Item Exposure Detection Methods • Bock, Muraki, & Pfeiffenberger (1988) • Chan, Drasgow, & Sawin (1999) • DeMars (2004) • Donahue & Isham (1998) • Han & Hambleton (2004) • Kim, Cohen, & Park (1995) • CUSUM and Psychometric Applications: • Hawkins & Olwell (1998) • Meijer & van Krimpen-Stoop (2003) • Montgomery (2005) • van Krimpen-Stoop & Meijer (2002) • Veerkamp & Glas (2000)
Contacts Yongwei Yang: yongwei_yang@gallup.com Abdullah Ferdous: aferdous@measuredprogress.org Tzu-Yun Chin: tzuyun@unlserve.unl.edu THANK YOU