Download
1 / 32
320 likes | 620 Vues
Terrestrial Wildlife Modeling in GIS RESM 493q Wed Nov 18. Terrestrial Wildlife Modeling. Habitat suitability modeling Gap Analysis Project. Example: Habitat suitability modeling. Habitat suitability indices: quantify specific habitat requirements of fish/wildlife species Use of GIS:

E N D
Terrestrial Wildlife Modeling • Habitat suitability modeling • Gap Analysis Project
Example: Habitat suitability modeling • Habitat suitability indices: quantify specific habitat requirements of fish/wildlife species • Use of GIS: • Map key habitat elements • Assign score or values to each element • Combination & overlay of results
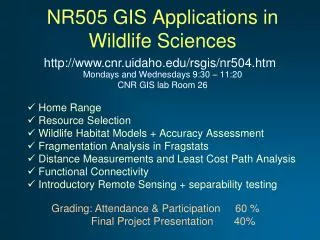
Wildlife habitat assessment GIS and remote sensing data collection techniques for aquatic systems differ from terrestrial habitats. Examples of aquatic habitat characteristics: • Surrounding land cover, riparian vegetation • -Water depth • Water quality • Substrate • Slope, stream gradients • Valley segment types • Geology (sandstone versus limestone) Habitat Assessment
Wildlife habitat assessment GIS techniques and data can be used to describe landscape characteristics to assess habitat quality and quantity. Examples of terrestrialhabitat characteristics: Derived from DEM: • Elevation • Slope • Aspect • Landform index • (Valley or ridge, concavity) Derived from aerial photos/land cover: • Land cover, vegetation • Forest stand composition, age, size • Land cover or vegetation diversity, variety, majority Habitat Assessment
Example – white-tailed deer habitat Methods – Deer Habitat Quantification for Michigan • Conservative and liberal estimates of required deer habitat elements of forage/browse & cover were generated from existing land cover maps. • Land cover was reclassified into types appropriate for forage/browse (generally agricultural) and types appropriate for cover (generally forested). • Habitat was quantified as cover areas larger than a minimum area with adjacent forage/browse habitat within a maximum allowed distance. Reference: Strong (2001) Michigan Department of Natural Resources Habitat Assessment
Example – white-tailed deer habitat High estimate Low estimate Conservative and liberal estimates of both cover and forage were mapped and tabulated at the county level. Habitat Assessment
Methods – white-tailed deer GIS operations used in modeling: Buffer remaining cover by 100m Select forage within 100m of cover Eliminate cover areas under 4 ha • Reclassify • land use: • Conserv. cover • Liberal cover • Conserv. forage • Liberal forage conservative Buffer remaining cover by 200m Select forage within 200m of cover Eliminate cover areas under 2 ha liberal Spatial Analyst: Reclassify Spatial Analyst: Convert raster to feature, select by attributes Buffer Wizard Select by location Habitat Assessment
Results – white-tailed deer Habitat Assessment
Habitat suitability analysis Habitat Suitability Index (HSI): • USFWS has developed HSI methods to assess habitat quality and quantity for individual wildlife species. • HSI models are based on calculating scores associated with variables representing requirements of particular species (such as food, cover), very specific to each species • Overall HSI scores range from 0 to 1 (1 is most suitable) • Models exist for over 150 species (available from USFWS) HSI Models and GIS: • Some models lend themselves to the use of GIS to quantify certain variables • Not all variables in a given HSI can be found using GIS Habitat Assessment
Legend Unsuitable Moderately suitable Highly suitable Very highly suitable Example: HSI model for beaver • Habitat layers: • Slope < 15% • Preferred land cover (forested wetland is best) • Proximity to water • Distance from roads/bridges • Assign numeric score to each layer • Final map indicates habitat suitability Source: Amanda White, RESM 593 Student Project Fall 2005 http://www.nrac.wvu.edu/RESM493/Fall05/students/White/index.html
Example: HSI model for beaver • Habitat layers: • Slope < 15% • Preferred land cover (forested wetland is best) • Within 100m to water • At least 200 m from roads/bridges • Assign numeric score to each layer • Final map indicates habitat suitability Source: Amanda White, RESM 593 Student Project Fall 2005 http://www.nrac.wvu.edu/RESM493/Fall05/students/White/index.html
Terrestrial wildlife management with GIS example GAP Analysis: Nationwide project sponsored by USGS What Is GAP? “A gap is the lack of representation or under-representation of an element of biodiversity (plant community or animal species) in an area intended for its long term maintenance. Gap analysis is a process to keep common species common by plugging the gaps in our network of lands managed for biodiversity.” Not focused at all on endangered species
WV-GAP Analysis Highlights • WV-GAP mapped and analyzed the distribution of native & breeding terrestrial wildlife species in WV including: • 124 species of butterflies • 84 reptiles and amphibians • 168 birds • 58 mammals • Special habitat model used for wetland/riparian reptiles & amphibians • Special Gap Analysis of species utilizing cave habitats
# Data layer or result A GIS analysis step Gap Analysis GIS Layers & Methods Land Cover/ Habitat Map 1 4 6 “Gaps” or Conservation Needs Predicted Distribution Map Species Range Maps A B 2 Habitat Relationship Database 5 3 Stewardship Map
Gap Land Cover Map 1 Data Source: Landsat TM imagery Imagery interpreted & classified using aerial videography Results include ~ 25 land cover categories, including 8 forested types Land Use/Land Cover Map: The Land Use/Land Cover map is used as a model of potential habitats for butterfly and vertebrate species.
Species Range Maps 2 Description: EPA 635 km2 hexagon cells Each hexagon attributed with presence/absence of each species Data sources: • Varies by taxonomic group • Research, expert knowledge, museum collections, published data
Habitat Relationship Database 3 Data Source Details: Literature references. Larger Access database was subsetted for use in GIS software as DBF table. Reptiles and Amphibians in WV by Greene and Pauley Example of hexagon range map for the butterfly Diana
Yes Yes Predicted Distribution Map 4 Data Source Details: Predicted distribution is mapped from intersecting appropriate habitats with species range (hexagons). • Select by attributes • Select by location Result: Predicted Distribution Map of all habitats Habitat used Not used
Land Stewardship Map 5 Data Source Details: Mapped from existing digital and paper sources.
NF Wilderness areas Most protected Least protected Wildlife mgmt areas Private lands with few restrictions Land Stewardship Map Details: Stewardship polygons also attributed with level of biodiversity protection (associated with degree of management). Examples:
Gaps and Conservation Needs 6 Details: For each species, tabulate the area of predicted distribution within land stewardship polygons. (How much habitat is on state, federal, private land) Tabulate area by both land steward/managing agency AND level of protection (low-high). “Gaps” in protection (a species not being protected enough) are identified as those species with a very low % of their predicted distribution falling within lands managed for biodiversity protection. “Gaps” are opportunities for increased wildlife management attention and conservation.
Gap Analysis Process Example 1. Species range is mapped using hexagon grid. Correct land cover 2. Habitats used by species are selected from statewide map of all habitats. Selected habitat area is limited to polygons that intersect range (above). Correct land cover andrange Example: Diana (butterfly)
Most protected Moderately protected Limited protection Low protection No known protection Gap Analysis Process Example “Who owns it and what is the level of protection?” 3. Compute total area within mapped potential distribution by land steward/manager. 4. Compute total areas within mapped potential distribution by management status/level of protection.
Gap Analysis Process Example • Accuracy assessment: • Compare list of species predicted to occur by WV-GAP with species checklists or data for known locations such as parks. • Compile error of commission, omission. • Discuss and determine potential sources of error. Example: Gap Habitat Polygons are attributed with presence/absence of all species. Select habitat polygons intersecting the New River Gorge National River for accuracy assessment.
WV-GAP Results Summary highlights • West Virginia is over 82% forested, with mixed mesophytic forests as the dominant land cover type. • Species richness is highest across the Allegheny Mountain region of the state. • Approximately 10% of West Virginia is managed by state or federal agencies (stewardship). • Conservation “gaps” in West Virginia include open habitats and wildlife species utilizing open or edge habitats. • WV-GAP provides a broad-scale snapshot and several useful statewide data layers, but is not intended to replace long-term monitoring and other biological inventory related research.
Other Analysis by WV-GAP Example of Wetland/Riparian modeling Use cost distance for defining riparian corridors Traditional uniform buffer
Stewardship Status of Caves • 1 – Permanent protection • 2 – Seasonal protection • 3 – Limited protection • 4 – No protection/unknown Other Analysis by WV-GAP
Amphibians and Reptiles Vertebrate Species Map Atlas West Virginia Gap Analysis Project Natural Resource Analysis Center West Virginia Cooperative Fish and Wildife Research Unit USGS Biological Resources Division WV-GAP – Final Products U.S. Department of Interior U.S. Geological Survey A GAP ANALYSIS OF WEST VIRGINIA WV-GAP Species atlas USGS Science for a changing world Final report CD-ROM with datasets
WV-GAP Website www.nrac.wvu.edu/projects/gap/ Contains Links to: • Other GAP projects • Final report text (PDF) • Datasets for download • Species range maps – interactive web mapping
Using Results of WV-GAP: GapServ http://gapserv.cr.usgs.gov - Internet Map Server