Misleading Graphs in Statistics: Avoiding Distortion in Visualizing Trends
Learn how scaling axes in graphs can misrepresent data trends, understand the importance of accurate data display, analyze misleading charts, and discover characteristics of good graphics in statistics. Avoid common graphing mistakes to enhance data interpretation.

Misleading Graphs in Statistics: Avoiding Distortion in Visualizing Trends
E N D
Presentation Transcript
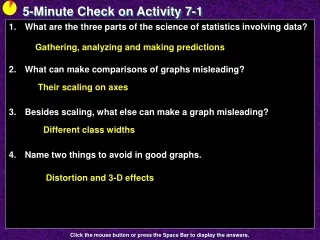
Activity 7 - 1 Visualizing Trends
Objectives • Recognize how scaling of the axes of a graph can misrepresent the situation
Vocabulary • Scale Factor – the values along the vertical or horizontal axis on a graph
Activity Statistics is the science of gathering, analyzing, and making predictions from data (numerical information). Statistics has become an indispensable tool in the study of such diverse area as medicine and health issues, the economy, marketing, manufacturing, population trends and the environment. An important part of a statistical study is organizing and displaying the data collected. Throughout this book, you have observed how useful graphs can be for identifying patterns and trends; however, graphs can be constructed to be misleading. The following charts will examine how graphs can be misleading.
Activity cont Compare the three graphs above. Do they look the same? Calculate the slope of the line in Graph 1: Calculate the slope of the line in Graph 2: Calculate the slope of the line in Graph 3: Now what do we say? At first glance 60 m = ------- = 3 20 20 m = ------- = 2 10 50 m = ------- = 5 10 Very different slopes
Example 1 The following graphs show the performance of two stocks over the first five months of the year. a) Which stock would you choose for your savings? b) Which graph appears to show the best performance? Explain c) The graphs have different scales along the y-axis. Which scale makes the graph appear to be rising more slowly? Both result in the same growth The one on the right Scale on the left
y x Example 2 Construct a line graph using the following US Census data: a) If we wanted the change to appear to be small, how do we change the y-axis? b) If we wanted the change to appear to be large, how do we change the y-axis? y-scale is larger y-scale is smaller
Example 3 36 40 Using the bar graphs below, answer the questions a) What do you concluded based on the left bar-graph? b) What do you concluded based on the right bar-graph? c) Now that the vertical scales for the graphs have been revealed, what are some of the differences in those scales? 34 30 32 20 30 10 2007 2008 2007 2008 Small increase between 07 and 08 Large increase (triples) between 07 and 08 Left: scale=5, starts at 0 Right: scale=1, starts at 28
Common Graphing Mistakes • Vertical Axis • Inconsistent vertical scaling • Incorrect vertical scaling • Vertical axis that doesn’t start at zero • Scaling in pictures different than that reflected by the data • Class widths • Values overlap • Class widths different
Characteristics of Good Graphics • Label the graphic clearly and provide explanations if needed • Avoid distortion. Don’t lie about the data • Avoid three-dimensions. Look nice, but often distract reader and result in misinterpretation • Don’t use more than one design in the same graphic. • Let the numbers speak for themselves • Sometimes graphs use a different design in a portion of the graphic to call attention to it
Summary and Homework • Summary • Graphs can be misleading • Comparative graphs should have the same scale • Homework • none