Download

1 / 59
590 likes | 681 Vues
Explore where the world's population is concentrated, population density variations, and factors affecting population growth across different regions. Discover key metrics such as arithmetic and physiological density and their implications.

E N D
Critical Issues in Population Geography More people are alive today than at any other time in human history-about 7.2 billion people! The world’s population increased at a faster rate during the second half of the twentieth century than ever before. Virtually all population growth today occurs in less developed countries (LDCs). The scientific study of population characteristics is called demography.
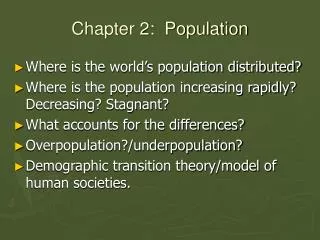
Where Is the World’s Population Distributed? • Population concentrations • Two-thirds of the world’s population are in four regions: • East Asia • E. China, Japan, Korea, Taiwan • South Asia • India, Pakistan, Bangladesh, Sri Lanka • Southeast Asia • Islands like Java, Sumatra, Borneo, Papua New Guinea, Philippines • Europe • Western & Eastern Europe, Western Russia
World Population Cartogram Fig. 2-1: This cartogram displays countries by the size of their population rather than their land area.(Only countries with 50 million or more people are named.)
World Population Distribution Fig. 2-2: World population is very unevenly distributed across the Earth’s surface and it can be compared to climate distribution.
Population Distribution Figure 2-2
Where Is the World’s Population Distributed? • Sparsely populated regions • The ecumene-portion of the Earth’s surface occupied by permanent human settlement. • People generally avoid: • Dry lands • Wet lands • Cold lands • High lands
Expansion of the Ecumene5000 B.C.–A.D. 1900 Fig. 2-3: The ecumene, or the portion of the Earth with permanent human settlement, has expanded to cover most of the world’s land area.
Where Is the World’s Population Distributed? • Population density-see p.51-53 • Arithmetic density-total # of people divided by total land area; also called population density • Physiological density-# of people supported by a unit of arable land • the higher the physiological density, the greater the pressure that people place on the land to produce enough food. • Agricultural density-# of farmers per unit of arable land • MDCs usually have lower agricultural densities b/c finance and technology allow fewer people to farm larger land areas.
Measures of Density Table 2-1
Arithmetic Population Density Fig. 2-4: Arithmetic population density is the number of people per total land area. The highest densities are found in parts of Asia and Europe.
Physiological Density Fig. 2-5: Physiological density is the number of people per arable land area. This is a good measure of the relation between population and agricultural resources in a society.
Where Has the World’s Population Increased? • Natural increase rate (NIR) • The percentage by which a population grows in a year; computing by subtracting CBR from CDR • Crude birth rate (CBR) • The number of births per 1,000 population • Crude death rate (CDR) • The number of deaths per 1,000 population • Doubling time • The number of years needed to double a population
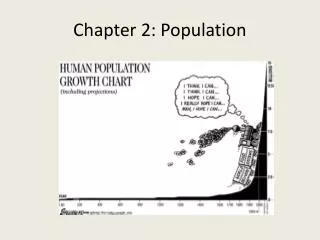
World Population Growth1950–2000 Fig. 2-6: Total world population increased from 2.5 to 6 billion in this half century. The natural increase rate peaked in the early 1960s and has declined since, but the number of people added each year did not peak until 1990.
Natural Increase Rates Fig. 2-7:The natural increase rate (NIR) is the percentage growth or decline in the population of a country per year (not including net migration). Countries in Africa and Southwest Asia have the highest current rates, while Russia and some European countries have negative rates.
Crude Birth Rates Fig. 2-8: The crude birth rate (CBR) is the total number of births in a country per 1,000 population per year. The lowest rates are in Europe, and the highest rates are in Africa and several Asian countries.
Crude Death Rates Fig. 2-12: The crude death rate (CDR) is the total number of deaths in a country per 1,000 population per year. Because wealthy countries are in a late stage of the demographic transition, they often have a higher CDR than poorer countries.
Where Has the World’s Population Increased? • Fertility • Total fertility rate (TFR) • The average # of births in a society; average # of children a woman will have throughout her childbearing years (@ ages 15-49) • Attempts to predict the future behavior of women around the world
Total Fertility Rates Fig. 2-9: The Total fertility rate (TFR) is the number of children an average woman in a society will have through her childbearing years. The lowest rates are in Europe, and the highest are in Africa and parts of the Middle East.
Where Has the World’s Population Increased? • Mortality • Infant mortality rate (IMR) • The annual # of deaths of infants under one year of age, compared with total live births; expressed per 1,000 live births rather than as a percentage. • The highest rates are in the poorer countries of sub-Saharan Africa and the lowest rates are in Western Europe. • In general, the IMR reflects the healthcare of a country. • Life expectancy • The average # of years a newborn infant can expect to live at current mortality levels. • Most favorable in Western Europe (late 70s) and least favorable in sub-Saharan Africa (late 30s).
Infant Mortality Rates Fig. 2-10: The infant mortality rate is the number of infant deaths per 1,000 live births per year. The highest infant mortality rates are found in some of the poorest countries of Africa and Asia.
Life Expectancy at birth Fig. 2-11: Life expectancy at birth is the average number of years a newborn infant can expect to live. The highest life expectancies are generally in the wealthiest countries, and the lowest in the poorest countries.
Key Issue 3Why Is Population Increasing at Different Rates in Different Countries?
Why Is Population Increasing at Different Rates? • All countries have experienced some changes in natural increase, fertility, and mortality rates, but at different times and at different rates. • Although rates vary among countries, a similar process of change in a society’s population, known as the demographic transition, is operating. • Because of differences among countries, the demographic transition diffuses to each country at different rates and produces local variations. • This process has several stages and every country is in one of them.
Why Is Population Increasing at Different Rates? • Demographic transition • Four stages: • Stage 1: Low growth-p.58-59 • Agricultural revolution • Started c.8000 BC, led to more stable supplies of food so more people could survive. • 8000 BC-AD 1750 the Earth’s pop increased from 5m-800m, a fairly modest pace. • Most of human history started here, but no country remains here today.
Why Is Population Increasing at Different Rates? • Demographic transition • Four stages: • Stage 2: High growth-p.59-60 • Industrial Revolution • Began c.1750 in England • Led to more wealth, healthier living conditions for some, new farm equipment, higher employment. • Countries in Europe and North America entered stage 2 about 1800. • Countries in Africa, Asia, and Latin America entered stage 2 about 1950 b/c of the medical revolution.
Why Is Population Increasing at Different Rates? • Demographic transition • Four stages: • Stage 3: Moderate growth-p.60 • Happens when CBR begins to drop sharply, often due to social customs and economic changes. • European and North American countries entered stage 3 in the early 20th Century, Asian and Latin American countries entered recently, and many African countries are still in stage 2.
Why Is Population Increasing at Different Rates? • Demographic transition • Four stages: • Stage 4: Low growth-p.60-62 • Zero population growth (ZPG) occurs when the CBR declines to the point where it equals the CDR, and the NIR approaches zero. • A TFR of approximately 2.1 produces ZPG.
Demographic Transition Fig. 2-13: The demographic transition consists of four stages, which move from high birth and death rates, to declines first in birth rates then in death rates, and finally to a stage of low birth and death rates. Population growth is most rapid in the second stage.
Demographic Transition in England Fig. 2-14: England was one of the first countries to experience rapid population growth in the mid-eighteenth century, when it entered stage 2 of the demographic transition.
Why Is Population Increasing at Different Rates? • A country’s stage of demographic transition gives it a distinctive population structure. • Population in a country is influenced by the demographic transition in two important ways: • % of pop in each age group • Distribution of males and females
Why Is Population Increasing at Different Rates? • Population pyramids-p.62-63 • A bar graph showing a place’s age and sex composition • Shape of the pyramid is determined mainly by the CBR • Age distribution • Dependency ratio-# of people too young or too old to work, compared to # of people in their productive years. • Sex distribution • Sex ratio-# of males per 100 females in the pop.
Population Pyramids See p.64 Figure 2-16
Percent of Population under 15 Fig. 2-15: About one-third of world population is under 15, but the percentage by country varies from over 40% in most of Africa and some Asian countries, to under 20% in much of Europe.
Why Is Population Increasing at Different Rates? • Countries are in different stages of the demographic transition • Three examples: • Cape Verde = High growth • Stage 2 since the 1950s • Chile = Moderate growth • Stage 3 since the 1960s • Denmark = Low growth • Stage 4 since the 1970s
Rapid Growth in Cape Verde Fig. 2-17: Cape Verde, which entered stage 2 of the demographic transition in about 1950, is experiencing rapid population growth. Its population history reflects the impacts of famines and out-migration.
Moderate Growth in Chile Fig. 2-18: Chile entered stage 2 of the demographic transition in the 1930s, and it entered stage 3 in the 1960s.
Low Growth in Denmark Fig. 2-19: Denmark has been in stage 4 of the demographic transition since the 1970s, with little population growth since then. Its population pyramid shows increasing numbers of elderly and few children.
Why Is Population Increasing at Different Rates? • Demographic transition & world population growth • Most countries = stage 2 or stage 3 of the Demographic Transition • Stages 2 and 3 are characterized by significant population growth • No country is in stage 1 of the demographic transition • It is easier to cause a drop in the CDR than in the CBR
Key Issue 4Why Might the World Face an Overpopulation Problem?
Why Might Overpopulation be a Concern? • Thomas Malthus on overpopulation: • One of the first to argue that the world’s rate of population increase was far outrunning the development of food supplies. • An Essay on the Principle of Population (1798): Population grows geometrically while food supply grows arithmetically
Why Might Overpopulation be a Concern? • Neo-Malthusians: • Argue that 2 characteristics of recent population growth make Malthus’s thesis even more scary than it was 200 years ago: • Malthus failed to predict that LDCs would have the most rapid pop growth because of medical technology not wealth • World pop is not only exceeding food production, but other resources, like clean air, suitable farmland, and fuel
Why Might Overpopulation be a Concern? • Criticism of Malthus includes the following: • Pessimistic viewpoint • Ideas based on a belief that the world’s supply of resources is fixed rather than expanding. • Failure to consider technological innovation • Larger pop could stimulate economic growth • Marxist critique • Argue that issues like poverty, hunger, and social welfare problems are due to unjust social and economic institutions, not pop growth
Malthus: Theory & Reality Figure 2-25
Food and Population, 1950–2000Malthus vs. Actual Trends Fig. 2-20: Malthus predicted population would grow faster than food production, but food production actually expanded faster than population in the second half of the twentieth century.
Why Might Overpopulation be a Concern? • The NIR only declines for 2 reasons: lower CBR or higher CDR. • Declining birth rates • Reasons for declining birth rates: • Reliance on economic development • Improving local economic conditions, including education and health care • Distribution of contraceptives • Reducing birth rates with contraception • Opposition for religious and political reasons
Crude Birth Rate Decline,1981–2001 Fig. 2-21: Crude birth rates declined in most countries between 1981 and 2001 (though the absolute number of births per year increased from 123 to 133 million).
Family Planning Figure 2-22