Hydroelectric Power Stability and Sustainability Analysis
60 likes | 159 Vues
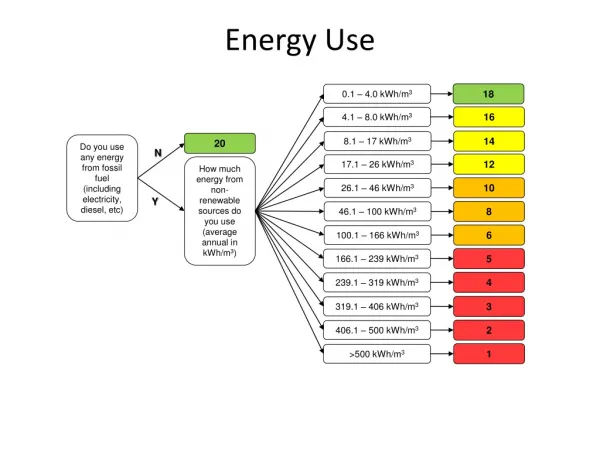
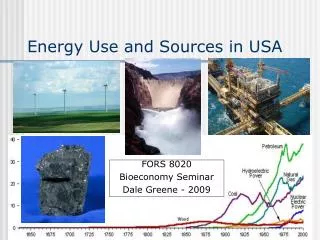
Explore the graph depicting hydroelectric power stability from 1960 to 1999. Discover the advantages and disadvantages of hydroelectric power, its impact on the environment, and its contribution to electricity generation and irrigation.

Hydroelectric Power Stability and Sustainability Analysis
E N D
Presentation Transcript
Energy Use in CT Tionna Miller
Graph Explained • Hydroelectic Power hasn’t increased or decreased. In the graph it shows from the year 1960 – 1999, it stayed right across the line all those years and hasn’t moved up or down.
Disadvantages • Dams are extremely expensive to build and must be built to a very high standard. • The high cost of dam construction means that they must operate for many decades to become profitable. • The flooding of large areas of land means that the natural environment is destroyed. • People living in villages and towns that are in the valley to be flooded, must move out.
Advantages • Once a dam is constructed, electricity can be produced at a constant rate. • If electricity is not needed, the sluice gates can be shut, stopping electricity generation. • Dams are designed to last many decades and so can contribute to the generation of electricity for many decades. • The lake's water can be used for irrigation purposes.
Does this trend support CT’s initiative to significantly decrease the use of non-renewable resources by the year of 2010?