Download
1 / 33
330 likes | 726 Vues
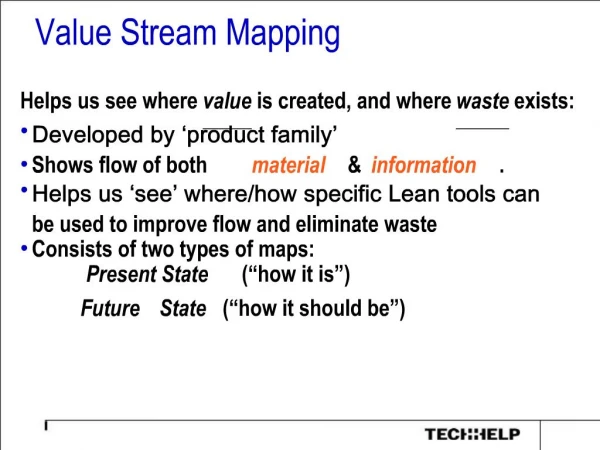
Value Stream Mapping Sandy Wander July 16, 2008. Value Stream Mapping Objectives. Terminal Objective: Given the appropriate guidelines and illustrated examples, understand what a value stream is and be equipped to apply it to all of your work processes. Value Stream Mapping Objectives.

E N D
Value Stream Mapping Objectives Terminal Objective: • Given the appropriate guidelines and illustrated examples, understand what a value stream is and be equipped to apply it to all of your work processes
Value Stream Mapping Objectives Enabling Objectives: • Learn the benefits of VS mapping • Learn how to create current state VS maps • Learn how to create future state VS maps • Learn how to prioritize improvement opportunities and create an actionable implementation plan
Lean Thinking “Where there is a product (or service) for a customer, there is a value stream. The challenge lies in seeing it.” Jim Womack Founder and Chairman Lean Enterprise Institute
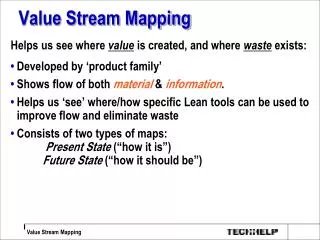
What is a value stream? • A value stream is all the activities required to bring a service/product from a customer request to fulfillment/completion • Activities can be described as value added (VA) or non-value added (NVA)
Defining Value • VA – any activity the customer values (and is willing to pay for) • Who are your customers? • What do they really want? • NVA – any activity that consumes time and/or resources but does not add value to the service or product for the customer • Necessary – regulatory requirements, etc. • Unnecessary – everything else
NVA activities • NVA activities are interspersed between the VA steps that typically account for 70-95% of steps, process time, and non-material costs • NVA = waste Typical percentages
The lean process Map the value stream Define value from the customer’s perspective Create flow; eliminate the root causes of waste Create pull where flow is difficult to achieve Seek perfection via continuous improvement
Principles of VSM • Diagnostic tool • Reveals hidden symptoms of larger problems • Strategic planning activity • Helps prioritize opportunities for improvement • Results in an implementation plan • Macro-level visual representation of: • Information flow • People and material flow • Each process block represents a handoff or a break in the timeline
Principles of VSM (continued) • Contains relevant metrics • Lead time – throughput/turnaround/flow time • Cycle time – touch/process time • Additional “flow stoppers”
Advantages of VSM • Helps visualize process steps and waste in the process • View process flow from the “thing’s” perspective • Helps “see the whole” • Focus on maximizing overall flow • Easy to learn • Shows the link between information and material flow
VSM Team • VSMs are strategic in nature • The resulting implementation plan is the tactical component • Team composition • Leadership • People with process knowledge • Outside eyes
Creating the current state VSM • Define product or service to map • Determine start and end (from customer’s perspective) • Outline major process blocks • Chunk of activities that occur before a handoff • OR… major stop in time line
Creating the current state VSM (continued) • Walk the process – be the “thing” • Start with the final step and walk backwards • Stay focused on the norm • Use the “70% rule” to avoid getting bogged down with exceptions • Interview workers to obtain data • Cycle time (CT) • Lead time (LT)
Example – Outpatient Endo Lab Schedule appointment Admission Prep Procedure Recovery/ prescription Discharge 1 hr 24 hr .75 hr .83 hr .5 hr .13 hr .1 hr 10 min 12 min 20 min 30 min 15 min 6 min LT = 8 min CT = 6 min LT = 6 min LT = 30 min CT = 15 min LT = 50 min CT = 30 min LT = 1440 min CT = 12 min LT = 45 min CT = 20 min LT = 60 min CT = 10 min Total Cycle Time = 93 min Total Lead Time = 1639 min %VA = 5.7%
Document Production Process Kickoff planning Document development Peer and tech review Initial Format/edit Internal review Incorporate Internal Review comments Submit To DP Formatting TOC PM Review Incorporate editorial comments Author’s Review of Editorial comments Tech edit Initialformat Distribution Proofing Final author DP checklist QC checked Create print copy Reproduction
First of three parts Kickoff planning Document development Peer and tech review Initial Format/edit Internal review Incorporate Internal Review comments 5 days 5 days 5 days 8 days 3 days 3 days 1 day 1 day 2 days 6 hr 8 hr 6 hr
Second of three parts Submit To DP Formatting TOC PM Review Incorporate editorial comments Author’s Review of Editorial comments Tech edit Initialformat 3 days 2 days 1 day 5 days 2 hr 5 hr 2 hr 1 hr 4 hr 1 day 6 hr 3 days 4 hr 1 hr
Third of three parts Distribution Proofing Final author DP checklist QC checked Create print copy Reproduction 3 hr 1 day 3 hr 1 day 3 hr 1 day 2 hr 2 hr 1 hr 4 hr 2 hr 4 hr 2 hr 2 hr
Totals of LT and CT Lead Time = 45.5 days Cycle Time = 14.625 days 32% VA (CT to LT ratio)
Current state mapping reminders • Start with the customer – information flow • Identify the product or service that is being worked on • Determine your process steps from cradle to grave • Identify the time it takes to perform the task without delays (starting or within the process) or interruptions within the process – cycle time
Current state mapping reminders (continued) • Identify and quantify the time it takes to perform the task including delays and interruptions – lead time (LT = CT + delays) • Investigate the causes of the waste between processes – what are the barriers to flow? • Map what typically (70% rule) happens • Calculate total processing time (cycle time) versus total lead time (throughput/turnaround)
Common current state issues • Lots of waiting • Lots of travel • Lack of communication (or lots of poor communication) • Lack of skills/relevant training • Too many handoffs • Too many approvals • Too many workarounds • Different prioritization rules in different departments
Common current state metrics • High LT (slow throughput/turnaround) • High WIP (waste in process – bottlenecks and backlogs) • Low CT/LT ratio (lots of waiting)
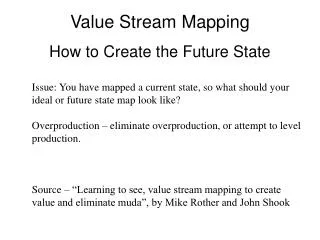
Achieving the future state • Objectives • Eliminate unnecessary NVA steps • Reduce necessary NVA steps • Optimize VA steps
Future state design considerations • Eliminate/merge steps • Create parallel paths • Implement pull if flow isn’t possible • Reduce/eliminate batches • Improve quality • Create standard work • Create an organized, visual workplace • Eliminate unnecessary approvals • Stop performing NVA tasks from customer’s point of view
Wastes in process (NVA) • Waiting • Unnecessary processing • Errors/defects • Motion (people) • Transportation (product) • Underutilized people
Waste considerations • Waste = elements of the process flow that add no value to the service/product • Waste adds cost and time, but not value • Objective is to eliminate/minimize non-value added steps • Remember that waste is a symptom – it is not the root cause of the problem
Future state metrics • Quality • Errors • Delivery • Lead time • Customer service • How well do you provide services (internal and external) • Cost • Reducing errors, rework, handoffs, waiting and lead time results in drastically reduced costs
Future state questions • What are the customer requirements? • Where can continuous flow be put in place? • Where should pull systems be implemented? • What is the single point of scheduling? • How do we level the load and the mix? • What should the management time frame be? • What process improvements are necessary to achieve the future state?
Thank you! • Customers might not know their entire range of needs, let alone what innovations would help them more. “If I had asked customers what they wanted, it would have been faster horses!” Henry Ford Founder Ford Motor Company