3-Hour Hands-On
860 likes | 1.14k Vues
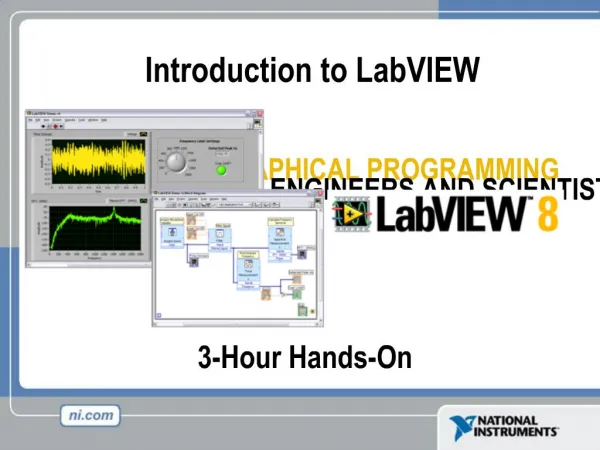
Introduction to LabVIEW. 3-Hour Hands-On. GRAPHICAL PROGRAMMING. FOR ENGINEERS AND SCIENTISTS. The Virtual Instrumentation Approach. LabVIEW Graphical Development System. Graphical programming environment Compiles code for multiple OS and devices

3-Hour Hands-On
E N D
Presentation Transcript
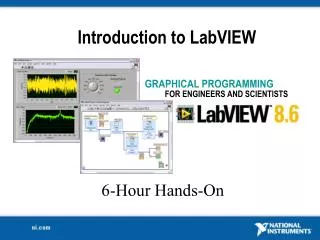
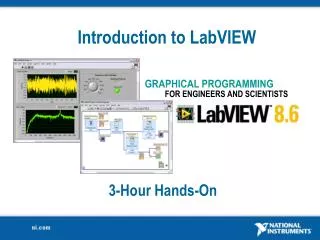
Introduction to LabVIEW 3-Hour Hands-On GRAPHICAL PROGRAMMING FOR ENGINEERS AND SCIENTISTS
LabVIEW Graphical Development System • Graphical programming environment • Compiles code for multiple OS and devices • Useful in a broad range of applications
Design Prototype Deploy Virtual Instrumentation Applications A single graphical development platform • Design • Signal and image processing • Embedded system programming • (PC, DSP, FPGA, microcontroller) • Simulation and prototyping • And more … • Control • Automatic controls and dynamic systems • Mechatronics and robotics • And more … • Measurements • Circuits and electronics • Measurements and instrumentation • And more …
Laptop PC PXI Modular Instrumentation PDA Desktop PC High-Speed Digitizers Counter/ Timers Distributed I/O and Embedded Control High-Resolution Digitizers and DMMs Multifunction Data Acquisition Dynamic Signal Acquisition Instrument Control Machine Vision Motion Control Digital I/O Signal Conditioning and Switching Unit Under Test The NI Approach – Integrated Hardware Platforms
Section I – LabVIEW Environment A. Setting Up Your Hardware • Data Acquisition Devices • NI-DAQmx • Simulated data acquisition • Sound card B. What Type of Device Should I Use? • Controls Palette • Tools Palette C. Components of a LabVIEW Application • Creating Custom VIs • Dataflow Programming D. Additional Help • Context Help Window • Tips for Working in LabVIEW
A. Setting Up Your Hardware Track A • Data Acquisition Device (DAQ) • Actual USB, PCI, or PXI device • Configured in Measurement and Automation Explorer (MAX) • Simulated Data Acquisition Device (DAQ) • Software simulated at the driver level • Configured in MAX • Sound Card • Built into most computers Track B Track C
What Type of Device Should I Use? * The above table may not be representative of all device variations that exist in each category
What is MAX? • Stands for Measurement & Automation Explorer • Configures and organizes all your National Instruments DAQ, PCI/PXI, GPIB, IMAQ, IVI, motion, VISA, and VXI devices • Tests devices Icon Found on Windows Desktop
Exercise 1 – Setting Up Your Device Track A • Use Measurement and Automation Explorer (MAX) to: • Configure and test your Data Acquisition (DAQ) device
Exercise 1 – Setting Up Your Device Track B • Use Measurement and Automation Explorer (MAX) to: • Configure and test your Simulated Data Acquisition (DAQ) device
Exercise 1 – Setting Up Your Device Track C • Use Windows to: • Verify your Sound Card Un-Mute Microphone
Open and Run LabVIEW Start»AllPrograms»National Instruments LabVIEW8.6 » Startup Screen: Start from a blank VI: New»Blank VI Start from an example: Examples»Find Examples… or
LabVIEW Programs Are Called Virtual Instruments (VIs) • Each VI has2 windows • Front Panel • User interface (UI) • Controls = inputs • Indicators = outputs • Block Diagram • Graphical code • Data travels on wires from controls through functions to indicators • Blocks execute by data flow
(Place items on the front panel window) Controls Palette Customize Palette View Control: Numeric Indicator: Numeric Slide
Functions (and Structures) Palette (Place items on the block diagram window) Structure: While Loop
Status Toolbar Run Button Continuous Run Button Abort Execution Additional Buttons on the Diagram Toolbar Execution Highlighting Button Retain Wire Values Button Step Function Buttons
Demonstration 1: Creating a VI Front Panel Window Graph Indicator Block Diagram Window Output Terminal Boolean Control Input Terminals
Dataflow Programming • Block diagram execution • Dependent on the flow of data • Block diagram does NOT execute left to right • Node executes when data is available to ALL input terminals • Nodes supply data to all output terminals when done
Debugging Techniques • Finding Errors • Execution Highlighting • Probes Click on broken Run button. Window showing error appears. Click on Execution Highlighting button; data flow is animated using bubbles. Values are displayed on wires. Right-click on wire to display probe; it shows data as it flows through wire segment. You can also select Probe tool from Tools palette and click on wire.
Exercise 2 – Acquiring a Signal with DAQ Track A & B • Use a LabVIEW template to: • Acquire a signal from your DAQ device This exercise should take 15 minutes.
Exercise 2 – Acquiring a Signal with the Sound Card Track C • Use LabVIEW to: • Acquire a signal from your sound card This exercise should take 15 minutes.
Context Help Window • Help»Show Context Help, press the <Ctrl-H> keys • Hover cursor over object to update window • Additional Help • Right-click on the VI icon and choose Help, or • Choose “Detailed help” on the context help window
Tips for Working in LabVIEW • Keystroke Shortcuts • <Ctrl-H> – Activate/Deactivate Context Help Window • <Ctrl-B> – Remove Broken Wires from Block Diagram • <Ctrl-E> – Toggle between Front Panel and Block Diagram • <Ctrl-Z> – Undo (also in Edit menu) • Tools»Options… – Set Preferences in LabVIEW • File»VI Properties – Configure VI Appearance, Documentation, and so on
Section II – Elements of Typical Programs A. Loops • While Loop • For Loop B. Functions and SubVIs • Three Types of Functions (from the Functions Palette) • Creating SubVIs • Functions Palette and Searching C. Decision Making and File I/O • Case Structure • Select (simple If statement) • File I/O Programming Model – Under the Hood
A. Loops While Loop • While Loop • Terminal counts iterations • Always runs at least once • Runs until stop condition is met For Loop • For Loop • Terminal counts iterations • Runs according to input N of count terminal
Drawing a Loop 2. Enclose code to be repeated 1. Select the structure 3. Drop or drag additional nodes and then wire
Three Types of Functions (from the Functions Palette) • Express VIs: interactive VIs with configurable dialog page (blue border) • Standard VIs: modularized VIs customized by wiring(customizable) • Functions: fundamental operating elements of LabVIEW; no front panel or block diagram (yellow)
What Types of Functions Are Available? Express Functions Palette • Input and Output • Signal and data simulation • Real signal acquisition and generation with DAQ • Instrument I/O Assistant (Serial and GPIB) • ActiveX for communication with other programs • Analysis • Signal processing • Statistics • Advanced math and formulas • Continuous time solver • Storage • File I/O
Searching for Controls, VIs, and Functions • Palettes are filled with hundreds of VIs • Press the search button to index all VIs for text searching • Click and drag an item from the search window to the block diagram • Double-click an item to open the owning palette
Creating SubVIs • Enclose area to be converted into a subVI • Select Edit»CreateSubVI from the Edit menu
LabVIEW Functions and SubVIsOperate Like Functions in Other Languages Function Pseudo Code function average (in1, in2, out) { out = (in1 + in2)/2.0; } SubVI Block Diagram Calling Program Pseudo Code main { average (in1, in2, pointavg) } Calling VI Block Diagram
Exercise 3.1 – Analysis Track A, B, & C • Use LabVIEW Express VIs to: • Simulate a signal and display its amplitude and frequency This exercise should take 15 minutes.
Exercise 3.2 – Analysis Track A • Use LabVIEW Express VIs to: • Acquire a signal and display its amplitude and frequency This exercise should take 15 minutes.
Exercise 3.2 – Analysis Track B • Use LabVIEW Express VIs to: • Acquire a signal and display its amplitude and frequency This exercise should take 15 minutes.
Exercise 3.2 – Analysis Track C • Use LabVIEW Express VIs to: • Acquire a signal and display its amplitude and frequency This exercise should take 15 minutes.
How Do I Make Decisions in LabVIEW? • Case Structures • Select (b) (a) (c)
File I/ File I/O File I/O – passing data to and from files • Files can be binary, text, or spreadsheet • Write/Read LabVIEW Measurements file (*.lvm) Writing to *.lvm file Reading from *.lvm file
Exercise 3.3 – Decision Making and Saving Data Tracks A,B,C • Use a case structure to: • Make a VI that saves data when a condition is met This exercise should take 15 minutes.
File I/O Programming Model – Under the Hood Open/Create/Replace File Read and/orWrite to File Close File Check for Errors
Section III–Presenting Your Results A. Displaying Data on the Front Panel • Controls and Indicators • Graphs and Charts • Building Arrays with Loops • Loop Timing B. Signal Processing • Math with the LabVIEWMathScript Node • Arrays • Clusters • Waveforms
What Types of Controls and Indicators Are Available? Express Controls Palette • Numeric Data • Number Input and Display • Analog Sliders, Dials, and Gauges • Boolean Data • Buttons and LEDs • Array and Matrix Data • Numeric Display • Chart • Graph • XY Graph • Intensity Graph • 3D Graph: Point, Surface, and Model • Decorations • Tab Control • Arrows • Other • Strings and Text Boxes • Picture/Image Display • ActiveX Controls
Charts – Add 1 Data Point at a Time with History Waveform chart – special numeric indicator that can display a history of values • Chart updates with each individual point it receives Controls»Express»GraphIndicators»Chart
Graphs – Display Many Data Points at Once • Waveform graph – special numeric indicator that displays an array of data • Graph updates after all points have been collected • May be used in a loop if VI collects buffers of data Controls»Express»GraphIndicators»Graph
Building Arrays with Loops (Auto-Indexing) Auto-Indexing Enabled • Loops can accumulate arrays at their boundaries with auto-indexing • For Loops auto-index by default • While Loops output only the final value by default • Right-click tunnel and enable/disable auto-indexing Wire becomes thicker 1D Array 0 1 2 3 4 5 Auto-Indexing Disabled Wire remains the same size Only one value (last iteration) is passed out of the loop 5
Creating an Array (Step 1 of 2) From the Controls»Modern»Array, Matrix, and Clustersubpalette, select the Array icon. Drop it on the front panel.
Create an Array (Step 2 of 2) • Place an array shell. • Insert data type into the shell (i.e., numeric control).
How Do I Time a Loop? • Loop Time Delay • Configure the Time Delay Express VI for seconds to wait each iteration of the loop (works on For and While Loops). • Timed Loops • Configure special timed While Loop for desired dt. Time Delay Timed Loop
Control and Indicator Properties • Properties are characteristics or qualities about an object • Properties can be found by right-clicking on a control or indicator • Properties include: • Size • Color • Plot style • Plot color • Features include: • Cursors • Scaling