Media and Water Testing
800 likes | 964 Vues
Media and Water Testing. Services provided by: UK Soils Laboratory Division of Regulatory Services Cooperative Extension Service College of Agriculture, Food and Environment Assistance with interpretation provided by departmental Extension faculty. Goal.

Media and Water Testing
E N D
Presentation Transcript
Services provided by:UK Soils Laboratory Division of Regulatory ServicesCooperative Extension ServiceCollege of Agriculture, Food and EnvironmentAssistance with interpretation provided by departmental Extension faculty
Goal Support County Extension Agents in effectively and efficiently providing soilless media and water testing services to help clientele diagnosis problems and manage agricultural enterprises
Agenda Introduction of topic and background information Water testing form, bottle and sample handling and procedures Water test results and interpretation Questions Soilless Media testing form and sample handling and procedures Media test results and interpretation Questions Pour-through method for a quick assessment Portable EC and pH meter
Materials in your hand for this training • Water Testing submission form with instructions • Soilless Media Testing submission form with instructions • HO 111, Understanding Irrigation Water Test Results and Their Implications • HO 112, Understanding Soilless Media Test Results and Their Implications on Nursery and Greenhouse Crop Management
Steps in the Process • Sample is taken and form completed • County sends completed form and sample to Regulatory Services, Soils Laboratory • Soils Laboratory analyzes the sample • Emails results back to county and to a Horticulture and/or tobacco specialist • Specialist adds comments/recommendations and emails back to county and Soils Lab
Irrigation Water Testing Chemical Properties Only
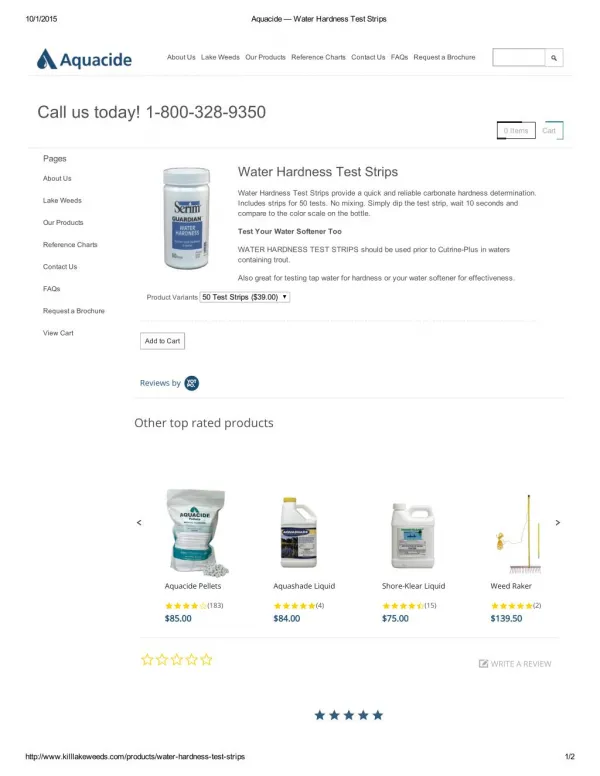
Sampling and Handling • From the source, not through irrigation system • Run briefly before sampling • Fill sample bottle and the pour down to ½-inch from top • Tighten cap • Store in refrigerator (briefly if necessary) • Do not freeze • Submit as soon as possible
Sampling and Handling • From the source, not through irrigation system • Run briefly before sampling • Fill sample bottle and the pour down to ½-inch from top • Tighten cap • Store in refrigerator (briefly if necessary) • Do not freeze • Submit as soon as possible
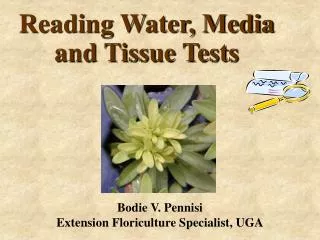
Interpretative Publication HO-111 Understanding Irrigation Water Test Results and Their Implications on Nursery and Greenhouse Crop Management Dewayne L. Ingram, Professor Department of Horticulture
pH • 5.5 to 7.0 - generally acceptable • Less than 5.5 - potential problem and the elemental constituents of the water should be examined closely • Greater than 7.0 - a possible problem, especially if there is high alkalinity; may interfere with the effectiveness of some pesticides and growth regulators when used as spray water
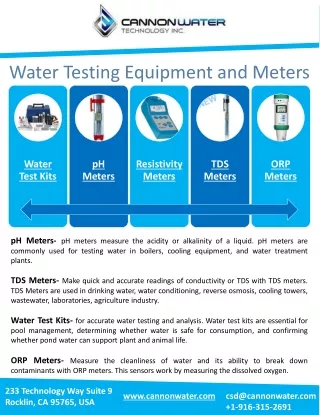
Electrical Conductivity (EC) • Gage of the free ions in a solution • Also referred to as dissolved/soluble salts • Units of Measure: • milli-siemens/cm (mS/cm) = mmhos/cm • Reciprocal of resistance (ohms) • 1 dS/m = 1 mmhos/cm = 1 mS/cm
Electrical Conductivity (EC) Source: Cavins, et al.
Electrical Conductivity (EC) • Measure of soluble salts • Less than 0.75 - no problem expected • 0.75 to 3.0 - increasing concern of excessive accumulation of soluble salts over time • Greater than 3.0 - expect severe problems
Alkalinity • Measure of the buffering capacity of water • Mostly CO3−2 and HCO3− • Associated with Ca2+ and Mg2+ • High alkalinity - same effect as limestone addition • May cause rise in substrate pH over time • Notice the term alkaline (pH > 7) is entirely different from the term alkalinity (capacity to resist a change in pH)
Alkalinity • Less than 150 ppm – no problem expected; 100 ppm is high for plug production • 150 to 300 ppm – increasing concern if the water pH is greater than 7.5. Expect the pH of the growing substrate to increase throughout production of the crop; use acidifying fertilizers regularly, use more acid growing substrate. • Greater than 300 ppm – significant problems if the water pH is greater than 7.5. The substrate pH will rise rapidly throughout the production of the crop and cause many nutrient problems. Acid injection into the water may be the only remedy if this water source must be used for irrigation.
Nitrate Nitrogen • Less than 5 ppm – no problem expected • Greater than 5 ppm – no cultural problems for plant production, however, a nitrate level greater than 5 is a good indication that your water source is polluted. There can be greater variability in this laboratory measurement compared to other measurements.
Phosphorus • 0 to 3 ppm – no problem expected • Greater than 5 ppm - could interfere with the uptake of other nutrients; addition of P in the fertilization program may not be necessary; could be signal of potential water source contamination by applied fertilizer, detergents, etc.
Potassium • 0 to 10 ppm – no problem expected • Greater than 10 ppm - no cultural problems for plant production expected. Potassium levels this high in Kentucky water samples are rare and could be potential sign that the potential water source is contaminated with fertilizer.
Calcium • Less than 60 ppm – expect calcium deficiencies in plant production unless calcium is added in the fertilizer program. • Greater than 60 ppm – no cultural problems for plant production expected. Hydroponic nutrient solutions for plant production use rates of 80 to 130 ppm Ca. Irrigation water with high calcium may need no additional Ca additions through fertilization. Higher amounts of Ca will compete with P and Mg and reduce their availability to plants.
Magnesium • Less than 25 ppm – expect Mg deficiencies in plant production unless magnesium is added in the fertilization program. • 25 to 50 ppm – should be adequate for production of most plants; hydroponic nutrient solutions use rates of 30 to 50 ppm Mg • Greater than 50 ppm – no cultural problems for plant production. Mg levels this high in Kentucky water samples are rare and could be a sign that the potential water source is contaminated with fertilizer.
Zinc • 0 to 0.3 ppm – no problem expected • Greater than 0.3 ppm - could cause toxicity in sensitive plants, especially at low substrate pH; high Zn in Kentucky water sources is rare and could be a sign that the potential water source is contaminated from old galvanized pipe.
Copper • 0 to 0.2 ppm – no problem expected • Greater than 0.2 ppm - could cause toxicity in sensitive plants, especially at low substrate pH; high Cu levels in Kentucky water sources are rare
Iron • 0 to 1 ppm – no problem expected • Greater than 1 ppm – could cause foliar spotting in sensitive plants and clog some micro-irrigation emitters • Greater than 5 ppm – can cause toxicity symptoms in some plants, particularly at a substrate pH below 5.5
Manganese • 0 to 1 ppm – no problem expected • 1 to 2 ppm – usually not toxic to plants but usually not found this high in Kentucky water sources
Boron • Less than 1.0 ppm – no problem expected. However, poinsettia is particularly sensitive to boron toxicity from B levels as low as 0.5 ppm. • 1.0 to 2.0 ppm – toxicity may be a problem on some plants • Greater than 2.0 ppm – expect toxicity symptoms at low substrate pH
Sodium • Less than 50 ppm – no problem expected • Greater than 50 ppm – expect salt concentration in the growing substrate to increase over time
Recommendations More information = better targeted interpretation and recommendations
High Alkalinity Water Target pH Low Alkalinity Water pH Drift Source: Bailey, 1996
Effect of Water Alkalinity on Substrate pH pH = 9 Alkalinity = 50 pH = 7 Alkalinity = 300
Effect of Water Alkalinity on Substrate pH pH = 9 Alkalinity = 50 Little or no effect on substrate pH pH = 7 Alkalinity = 300 Substantial increase in substrate pH
> 450 reverse osmosis 200-450 acid injection 100-200 acid reaction fertilizer < 75-100 no treatment Water Quality Treatment Options Total Alkalinity (ppm)
Well Municipal Creek pH 7.6 7.8 7.7 Conductivity 0.7 0.2 9.8 Alkalinity 278.0 63.0 90.0 Calcium 82.8 36.2 31.5 Magnesium 0.5 12.6 10.5 Sodium 65.2 8.1 9.4
Water Test Report for Teaching Greenhouse Tap Water Laboratory Results pH8.2Phosphorus 0.5ppmZinc0.1ppm Conductivity 0.34mmho/cmPotassium 2.5ppmCopper0.0ppm Alkalinity 102ppmCalcium49.4ppmIron0.0ppm Nitrate-N 1ppmMagnesium 6.6ppmManganese 0.0ppm Boron 0.0ppm Sodium 13.4ppm
Sampling and Handling • Variables • Crop species • Planting time • Container size • Environment • Limited by block management • Timing relative to activities & events • Several locations in representative block • 6-8 subsamples • Thoroughly mix • Submit a 2-pint sample; two sample bags