
Surfaces
E N D
Presentation Transcript
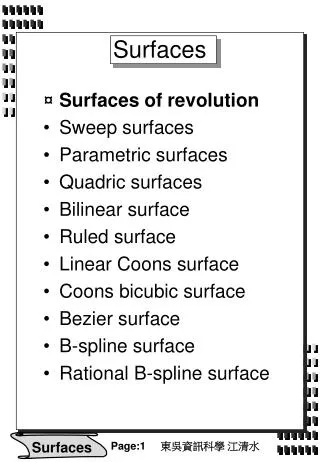
Surfaces Surfaces involve a third 'z' dimension (height/elevation/magnitude, quantity) in addition to x,y planimetric location. Any type of continuous data can be represented as a surface, whether it be ground elevation, barometric pressure, rainfall, crop yield, noise levels, population density, sales intensity, land value, income, crime rates, etc. Briggs GISC 6382 UT-Dallas
Example for Crime Data 3D Model of Crime Density in Boston, MA http://gis.mit.edu/classes/11.521/lectures/Lecture_14/Lect14.htm Briggs GISC 6382 UT-Dallas
3 basic methods for representing a surface: • DEM (digital elevation model): set of regularly spaced sampled ground points in the x and y dimensions (although spacing not necessarily the same in each) accompanied by an elevation measure (z dimension). The DEM terminology was introduced by USGS.Two concepts used for determining elevation at points within the grid cells: • Lattice: each point represents a value on the surface only at the center of the grid cell • Surface grid considers each sample as a square/rectangular cell with a constant surface value. • TIN (Triangulated Irregular Network) a set of adjacent, non-overlapping triangles with x, y coordinates and z vertical elevations for their vertices, along with topological relationship between the triangles and their adjacent neighbors. • Contour lines: lines of equal elevation, drawn at a given interval (e.g. every 6 or 25 feet) The general term digital terrain model (DTM) may be used to refer to any of the above surface representations when in digital form. DEM sometimes used synonymously with DTM—don’t. Briggs GISC 6382 UT-Dallas
Storing & Converting Surface Data • 3-D surfaces are normally stored in one of two forms within ArcGIS • as a GRID, which is ArcInfo's general raster format • as a TIN which is a vector format for surfaces • However, when you download data from the Internet, surface data may be in other formats, such as • DEM format, as originally developed by USGS • SDTS (Spatial Data Transfer Standard) format, which is an FGDC (Federal Geographic Data Committee) standard • E00 which is ESRI’s text formatted for distributing coverages and GRIDS • Points and breaklines • Conversion to GRID or TIN is generally required for display or analysis within the ArcGIS system • Generally, ArcToolbox has capabilities for converting these formats to GRIDs or TINs • Contour lines can be stored as vector lines in a coverage, shapefile, or geodatabase, • can only be used for map display but not analysis, so this is not a recommended format for surface storage.
Digital Elevation Model • Advantages • Simple conceptual model • Data cheap to obtain • Easy to relate to other raster data • Irregularly spaced set of points can be converted to regular spacing by interpolation • Disadvantages • Does not conform to variability of the terrain • Linear features not well represented • a sampled array of elevations (z) that are at regularly spaced intervals in the x and y directions. • two approaches for determining the surface z value of a location between sample points. • In a lattice, each mesh point represents a value on the surface only at the center of the grid cell. The z-value is approximated by interpolation between adjacent sample points; it does not imply an area of constant value. • A surface grid considers each sample as a square cell with a constant surface value. Briggs GISC 6382 UT-Dallas
GRID as a Storage Method • GRIDs are ESRI’s raster data format • Use for storing DEMS or other data in raster format • GRID stores data as either: • Integer: in which case there is an associated value attribute table (VAT) which contains one record for each different value in the raster (thus there are normally substantially fewer records in the VAT table than there are cells in the raster); this record stores the value itself, a count of the number of cells with that value, and any additional attributes the user wishes to to attach. Thus, the values could be codes for soil type and the VAT could contain fertility measures, soil name, construction suitability codes, etc. If you select a record in the VAT, all cells with that value will highlight in the View or Scene. • Floating point: (number with a decimal point) in which case there is no VAT table, and simply one decimal value per cell • Integer GRIDS are generally substantially faster to process. Briggs GISC 6382 UT-Dallas
Triangulated Irregular Network a set of adjacent, non-overlapping triangles computed from irregularly spaced points, with x, y horizontal coordinates and z vertical elevations. • Advantages • Can capture significant slope features (ridges, etc) • Efficient since require few triangles in flat areas • Easy for certain analyses: slope, aspect, volume • Disadvantages • Analysis involving comparison with other layers difficult Briggs GISC 6382 UT-Dallas
TIN as a Storage Method • TINs • are the most useful method for representing a continuous surface in a vector GIS system. • data sets comprising any combination of contours, breaklines and point elevations (either DEM or massed points) can be combined as input to create a TIN • TINS are especially useful for analytical purposes • Good model for representing surfaces • slope and aspect easily derived • simplify the calculation of surface area and volume Briggs GISC 6382 UT-Dallas
Creating a TIN No Breaklines Soft Breaklines Hard Breaklines The Data The Triangulation The Surface 3D View Break lines Linear features which define and control surface behavior in terms of smoothness and continuity. Briggs GISC 6382 UT-Dallas http://www.ian-ko.com/resources/triangulated_irregular_network.htm
valley hilltop ridge Contour (isolines) Lines Contour lines, or isolines, of constant elevation at a specified interval, Advantages • Familiar to many people • Easy to obtain mental picture of surface • Close lines = steep slope • Uphill V = stream • Downhill V or bulge = ridge • Circle = hill top or basin Disadvantages • Poor for computer representation: no formal digital model • Must convert to raster or TIN for analysis • Contour generation from point data requires sophisticated interpolation routines, often with specialized software such as Surfer from Golden Software, Inc., or ArcView Spatial Analyst extension Briggs GISC 6382 UT-Dallas
Other Concepts: Breaklines and Massed Points • Breaklines:lines following a significant break in slope, with elevations (not usually constant) indicated along them; examples are lines following streams, ridge crests, or cliff edge; roads are often 'breaklines' in urban areas; • Massed Points a set of points, usually irregularly spaced, comprising x,y coordinates together with a z value measuring height or magnitude. • Although they could be viewed as another method of representing a surface, massed points is a terminology used in ArcView/ArcInfo and best thought of as a set of point elevations which can be used to create DEMs (via interpolation), contours, or TINs • Massed points can be generated by extracting point information from any set of data having elevation information including a DEM, elevation points along breaklines, selected points along contours, elevation data recorded at nodes on lines, networks or polygons, value data associated with a polygon. Briggs GISC 6382 UT-Dallas
Other concepts: surface polygons • Clipping polygon • Define boundaries of the study area for which you have data • Surface will not be correct, especially around edges, unless this is defined • Erase polygon • Holes for which there is no data • Important to define for correct interpolation • Replace polygon • Areas of constant height e.g. lake • Use when data with different heights exists in the interior of these polygons • If there is no contradictory data, add these as breaklines for more efficient processing Briggs GISC 6382 UT-Dallas
Hard and Soft Breaklines/Polygons • Breaklines can be added to a TIN as massed points, or as hard or soft breaklines • Breaklines become one or a series of triangle edges. • distinction between hard and soft is significant for interpolation • for example, the Natural Neighbors interpolation. • Hard lines (and hard polygon boundaries) define distinct breaks in slope. Linear interpolation should not occur across these lines. • Examples of hard features include curbs, streams, and shorelines. • Soft lines (and soft polygon boundaries) do not interrupt surface smoothness. Soft features generally have no geomorphic significance but are needed in the triangulation none the less. • examples of soft features include contour lines, clip polygons used to delineate the data area of the TIN, the study area, or a political boundary, that have nothing to do with topography. Briggs GISC 6382 UT-Dallas
Terrains • New format for surface data introduced with ArcGIS 9.2 • Intended to support massive amounts of data from sources such as LIDAR and SONAR • Includes support for the LAS LIDAR data format • Supported only within ArcMAP and ArcGlobe, not ArcScene • Similar more to a topology • Stored in a geodatabase (personal, file, or SDE) feature dataset and contain rules as to how feature classes within the feature dataset are used to construct a surface • Data is retrieved and used to build a TIN on-the-fly See: ArcToolbox/3D Analyst Tools/Terrains Briggs GISC 6382 UT-Dallas
Viewing & Processing Surface Data To go beyond simple display of rasters or contour lines, you will need to use the 3-D Analyst or Spatial Analyst extensions. • GRIDS can be displayed in ArcMap (and also ArcScene and ArcGlobe) • But Spatial Analyst extension is required to analyze GRIDS • Tools available in ArcToolbox/Spatial Analyst Tools • TINS require 3-D Analyst extension to displayand analyze • ArcScene is used to display and analyze TINS in Version 8 • ArcGlobe partially replaces ArcScene in Version 9 • Faster display of large amounts of data, but • will not support subterranean views—use ArcScene for this • ArcToolbox/3-D Analyst Tools has TIN analysis tools • Note: certain raster tools from Spatial Analyst are listed here also • Contour lines can be created from a TIN using ArcScene or from a GRID using Spatial Analyst, or with tools in ArcToolbox (if you have the extensions), and stored as a shapefile, coverage or gdb feature class • See ArcToolbox/Spatial Analyst Tools/Surface/Contour • Or ArcToolbox/3D Analyst Tools/Raster Surface/Contour (same tools) • ArcScene and ArcToolbox will convert between all these formats • See ArcToolbox/3D Analyst/Conversion: • Import from Raster Export to Raster • Import from TIN Export to TIN
Interpolation • Critical component for raster surface creation • Used to create GRIDs (ArcGIS format for rasters) which contain equally spaced cells from irregularly spaced point data. • Five methods (each with additional options) are available to do interpolation • Inverse Distance Weighting • Spline • Trend • Natural Neighbor • Kriging Briggs GISC 6382 UT-Dallas
Inverse Distance Weighting (IDW): assumes that each input point has a local influence that diminishes with distance, which is achieved by weighting the points closer to the processing cell greater than those farther away. • Output values for each cell may be based on • Nearest neighbor option which weights a specified number of points (the “k" nearest neighbors). If k=n then all points are included. • or Radius option which uses all points within a specified radius. • A Power Parameter controls the significance of the surrounding points upon the interpolated value: the higher the value the less influence from distant points. • In essence, this is the rate of attenuation with distance; a higher value means a steeper slope for attenuation • A barrier input line theme can be specified to represent a cliff, ridge, or some other interruption in a landscape; points beyond the barrier are excluded from the weighting. A choice of No Barriers will use all points specified in the No. of Neighbors or within the identified radius. • Use IDW, for example, to interpolate a surface of consumer purchasing. More distant locations have less influence, because people are more likely to shop closer to home; a barrier could be railroad lines assuming nobody "crosses the tracks" to shop. • An IDW surface passes through the measured points (referred to as an “exact interpolation”), and interpolated surface is never above or below the highest/lowest measured points
Spline is a general purpose interpolation method that fits a minimum-curvature surface exactly through the input points. • Conceptually, it is like bending a sheet of rubber to pass through the points, while minimizing the total curvature of the surface. • -The Regularized option yields a smoother surface • the weight parameter defines the “weight of the third derivatives of the surface in the curvature minimization expression.” The higher its value the smoother the surface -The Tension option tunes the stiffness of the surface according to the character of the modeled phenomenon. • the weight parameter defines the “weight of the tension”. The higher its value the coarser the surface • The number of points parameter identifies the number of points per region used for local approximation. Higher values produce smoother surfaces. • The spline method is best for gently varying surfaces such as elevation, water table heights, or pollution concentrations. It is not appropriate if there are large changes in the surface within a short horizontal distance, because it can overshoot estimated values. • Like IDW it is an “exact interpolation” in that the surface passes through the measured points, but unlike IDW the surface can extend above or below measured points Briggs GISC 6382 UT-Dallas
Trend: Uses a polynomial regression to fit a least-squares surface to the input points. The surface is chosen so that the sum of the squared differences (vertical distances on the z axis) between the original points and their estimate on the surface is minimized for the entire surface. • The resulting surface seldom passes through the original points since it performs a best fit for the entire surface, thus it is an “inexact interpolation.” The lower the RMS error, the more closely the interpolated surface represents the input points. • Order of the polynomial used to fit the surface is specified by user. The most common order of polynomials is 1 through 3. • A first-order linear trend surface interpolation simply performs a least-squares fit of a plane to the set of input points. • When an order higher than 1 is used, the interpolator may generate a Grid whose minimum and maximum might exceed the minimum and maximum of the input points. • As the order of the polynomial is increased, the surface being fitted becomes progressively more complex. A higher order polynomial will not always generate the most accurate surface, it is dependent upon the data. • A logistic option is available for generating a trend surface for prediction of presence/absence of certain phenomena (in the form of probability) for a given set of locations (x,y) in space. The z value is a categorized random variable with only two possible outcomes, for instance, the existence of an endangered species or the lack of existence of that species. These two values of z can be coded as 1 and 0, respectively. It creates a continuous probability Grid with cell values between 1 and 0. A maximum likelihood estimation is used to calculate the logistic probability surface model. Trend surface interpolation creates smooth surfaces. (see Interp MakeTrend Discussion in AV Help) Briggs GISC 6382 UT-Dallas
Natural neighbor: similar to IDW in that it applies weights to a set of neighbor points, so it is a local rather than global interpolation • However, point selection is based on delauney triangles, and weighting is based on area of thiessen polygons • “robust” and “conservative, artifice free” • interpolated heights will be within range of sample heights (none above or below) and it will not produce peaks, ridges, etc. that are not in the sample data • Exact in that surface passes through all input points • Requires no user input such as search radius, sample count, etc.. • Can handle large numbers of points that may crash other methods • Works with regularly and irregularly distributed points • Also known as Sibson interpolation Briggs GISC 6382 UT-Dallas
Kriging is an advanced procedure that assumes the distance or direction between sample points shows spatial correlation that describes the surface. • Kriging assumes that the same pattern of variation can be observed at all locations on the surface. • This pattern is estimated by constructing Variograms based on sets of n points or all points within a specified radius. • The best estimation method for generating the output surface is then based on an interactive examination of the Variogram. • This approach is most useful when you already know about spatially correlated distance or direction bias within the data. It is most commonly used in geology and soil science. Briggs GISC 6382 UT-Dallas
Concepts Derived from Surfaces Slope Maximum rate of change, from each cell to its neighbors. The output slope grid theme represents the degree of slope (e.g., 10 degree slope) for each cell location. Aspect Identifies the steepest down-slope direction from each cell to its neighbors. The values of the output grid theme represent the compass direction of the aspect; 0 is true north, a 90 degree aspect is to the east, and so forth. Cells in the input grid, or faces of input TIN theme of zero slope (flat) are assigned an aspect of -1. If any neighborhood cell surrounding the processing cell are No Data, they are assigned the value of the processing cell, then the aspect is computed. A legend representing the 8 cardinal directions is assigned to the output grid theme (e.g., east [67.5 - 112.5 degrees], southeast [112.5 - 157.5]). Hillshade The hypothetical illumination of a surface as part of an analysis step or for graphical display. Hillshade can be used to determine the length of time and intensity of the sun in a given location. Various features in the input grid or TIN theme can be accentuated, and different effects achieved, by altering the azimuth and altitude parameters. The azimuth is expressed in positive degrees from 0 to 360, measured clockwise from north. The altitude is expressed in positive degrees, with 0 degrees at the horizon and 90 degrees directly overhead. Briggs GISC 6382 UT-Dallas
Draping an Image http://www.newc.com/rsat/advanced/Boulder/step3.html Placing a 2-D image (or vector layer) over a 3-D surface --Inputes elevation (z) to the 2-D layer Briggs GISC 6382 UT-Dallas