Statistics in Business and Economics
Explore the applications of statistics in business and economics, from data collection to decision-making. Learn how accounting firms, financial analysts, and marketing professionals utilize statistical techniques. Discover the importance of statistical methods in making informed decisions and forecasting economic trends. This chapter covers the basics of descriptive and inferential statistics, types of data, scales of measurement, and more. Gain insights into the significance of statistical analysis in various sectors of the economy.

Statistics in Business and Economics
E N D
Presentation Transcript
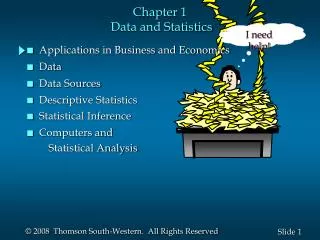
Chapter 1 Data and Statistics • Applications in Business and Economics • Data • Data Sources • Descriptive Statistics • Statistical Inference
Applications in Business and Economics Statistics is the process of data collection, organizing, analyzing the data, interpertation and make decisions. • Accounting Public accounting firms use statistical sampling procedures when conducting audits for their clients. • Finance Financial analysts use a variety of statistical information, including price-earnings ratios and dividend yields, to guide their investment recommendations. • Marketing Point-of-sale scanners at retail checkout counters are being used to collect data for a variety of marketing research applications.
Applications in Business and Economics • Production A variety of statistical quality control charts are used to monitor the output of a production process. • Economics Economists use statistical information in making forecasts about the future of the economy or some aspect of it.
Why Study Statistics? • Numerical information is everywhere • Statistical techniques are used to make decisions that affect our daily lives • The knowledge of statistical methods will help you to understand how decisions are made and give you a better understanding of how they affect you. • No matter what line of work you select, you will find yourself faced with decisions where an understanding of data analysis is helpful. Some examples of the need for data collection. • Research analysts evaluate many facets of a particular stock before making a “buy” or “sell” recommendation. • The marketing department Managers must make decisions about the quality of their product or service.
What is Meant by Statistics? • In the more common usage, statistics refers to numerical information. Examples: the average starting salary of college graduates, the number of deaths due to alcoholism last year etc. • We often present statistical information in a graphical form for capturing reader attention.
Types of Statistics – Descriptive Statistics - methods of organizing, summarizing, and presenting data in an informative way. Inferential Statistics: A decision, estimate, prediction, or generalization about a population, based on a sample.
Population versus Sample • A populationis a collection of all possible individuals, objects, or measurements of interest. • A sample is a portion, or part, of the population of interest
Data • Elements, Variables, and Observations • Scales of Measurement • Qualitative and Quantitative Data • Cross-Sectional and Time Series Data
Data and Data Sets • Data are the facts and figures that are collected, summarized, analyzed, and interpreted. E.g., • IBM’s sales revenue is $100 bn.; stock price $80. • The data collected in a particular study are referred to as the data set. E.g., • The sales revenue and stock price data for a number of firms including IBM, Dell, Apple, etc.
Elements, Variables, and Observations • The elements are the entities on which data are collected. E.g., • IBM, Dell, Apple, etc. in the previous setting. • A variable is a characteristic of interest for the elements. E.g., • Sales revenue, stock price (of a company) • The set of measurements collected for a particular element is called an observation. • Sales revenue, stock price for 2003
Scales of Measurement • Scales of measurement include: • Nominal • Ordinal • Interval • Ratio • The scale determines the amount of information contained in the data. • The scale indicates the data summarization and statistical analyses that are most appropriate.
Scales of Measurement • Nominal • data that is classified into categories and cannot be arranged in any particular order. A numeric code may be used. The Nominal Scales Categorize Individuals or Groups And This Scale Measure The Percentage Response E.G. Male- Female, Pakistani-American Example: Students of a university are classified by the school in which they are enrolled using a nonnumeric label such as Business, Humanities, Education, and so on. Alternatively, a numeric code could be used for the school variable (e.g. 1 denotes Business, 2 denotes Humanities, 3 denotes Education, and so on).
Scales of Measurement • Ordinal similar to the nominal level, with the additional property that meaningful amounts of differences between data values can be determined. It categorizes and ranks the variables according to the preferences e.g. from best to worst, first to last, a numeric code may be used. e.g. rank job characteristics • Example: Students of a university are classified by their class standing using a nonnumeric label such as Freshman, Junior, Senior. Alternatively, a numeric code could be used for the class standing variable (e.g. 1 denotes Freshman, 2 denotes, Junior and so on).
Scales of Measurement • Interval • The data have the properties of ordinal and interval between observations is expressed in terms of a fixed unit of measure. Preferences on a 5/7 point scale. It also measures the magnitude of the differences in the preferences among the individuals. Interval data are always numeric. • Example: strongly disagree, disagree, neither agree nor disagree, agree, strongly agree etc.
Scales of Measurement • Ratio • The data have all the properties of interval data and the ratio of two values is meaningful. This scale must contain a zero value that indicates that nothing exists for the variable at the zero point. • Example: Variables such as distance, height, weight, and time use the ratio scale.
Scales of Measurement • Ratio scales: used when exact numbers are called for e.g. how many orders do you operate? • Interval scale: used for responses to various items on 5/7 points use of stats measures as ratio scale, a. mean, stand. deviation. • Ordinal scale: for preference in use, stats measures are median, range, rank order correlations • Nominal scale: used for personal data
Types of Variables A.Qualitative variable - the characteristic being studied is nonnumeric. EXAMPLES: Gender, religious affiliation, type of automobile owned, eye color are examples. use either the nominal or ordinal scale of measurement. B.Quantitative variable - information is reported numerically. EXAMPLES: balance in your account, minutes remaining in class, or number of children in a family.
Quantitative Data • Quantitative data indicate either how many or how much. • Quantitative data that measure how many are discrete. • Quantitative data that measure how much are continuous. • Quantitative data are always numeric. • Arithmetic operations (e.g., +, -) are meaningful only with quantitative data.
Cross-Sectional and Time Series Data • Cross-sectional data are collected at the same or approximately the same point in time. • Example: data detailing the number of building permits issued in June 2000 • Time series data are collected over several time periods. • Example: Texas in each of the last 36 months
Data Sources • Existing Sources • Data needed for a particular application might already exist within a firm. Detailed information is often kept on customers, suppliers, and employees. • Substantial amounts of business and economic data are available from organizations that specialize in collecting and maintaining data. • Government agencies are another important source of data. • Data are also available from a variety of industry associations and special-interest organizations.
Data Sources • Internet • The Internet has become an important source of data. • Most government agencies, like the Bureau of the Census (www.census.gov), make their data available through a web site. • More and more companies are creating web sites and providing public access to them. • A number of companies now specialize in making information available over the Internet.
Data Acquisition Considerations • Time Requirement • Searching for information can be time consuming. • Information might no longer be useful by the time it is available. • Cost of Acquisition • Organizations often charge for information even when it is not their primary business activity. • Data Errors • Using any data that happens to be available or that were acquired with little care can lead to poor and misleading information.
Descriptive Statistics • Descriptive statistics are the tabular, graphical, and numerical methods used to summarize data.
Example: Hudson Auto Repair The manager of Hudson Auto would like to have a better understanding of the cost of parts used in the engine tune-ups performed in the shop. She examines 50 customer invoices for tune-ups. The costs of parts, rounded to the nearest dollar, are listed below.
Example: Hudson Auto Repair • Tabular Summary (Frequencies and Percent Frequencies) Parts Percent Cost ($)FrequencyFrequency 50-59 2 4 60-69 13 26 70-79 16 32 80-89 7 14 90-99 7 14 100-109 510 Total 50 100
Example: Hudson Auto Repair • Graphical Summary (Histogram) 18 16 14 12 Frequency 10 8 6 4 2 Parts Cost ($) 50 60 70 80 90 100 110
Example: Hudson Auto Repair • Numerical Descriptive Statistics • The most common numerical descriptive statistic is the average (or mean). • Hudson’s average cost of parts, based on the 50 tune-ups studied, is $79 (found by summing the 50 cost values and then dividing by 50).
Statistical Inference • Statistical inference is the process of using data obtained from a small group of elements (the sample) to make estimates and test hypotheses about the characteristics of a larger group of elements (the population).
Example: Hudson Auto Repair • Process of Statistical Inference 1. Population consists of all tune-ups. Average cost of parts is unknown. 2. A sample of 50 engine tune-ups is examined. 3. The sample data provide a sample average cost of $79 per tune-up. 4. The value of the sample average is used to make an estimate of the population average.