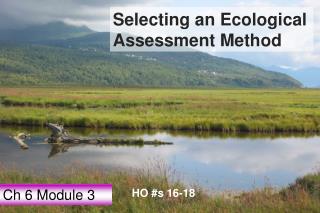
Selecting an Ecological Assessment Method
Selecting an Ecological Assessment Method. Ch 6 Module 3. HO #s 16-17. Objectives. Difference between models and methods Basic considerations in method selection Array of methods Selecting a method Overview of commonly used methods Model certification requirements.


Selecting an Ecological Assessment Method
E N D
Presentation Transcript
Selecting an Ecological Assessment Method Ch 6 Module 3 HO #s 16-17
Objectives • Difference between models and methods • Basic considerations in method selection • Array of methods • Selecting a method • Overview of commonly used methods • Model certification requirements
What is a Model? An abstraction or simplification of reality A set of the most critical components of the modeled system, i.e., a subset It is general, precise or realistic, but not all three What exactly it is and what it will do is a function of the builder and the data used Focus on change
What Kinds of Models Are There? Conceptual and relational Mathematical or relational Factors used in models: 1. Physical Chemical Biological Habitat Spatial
A Simple Thought Model Deforesta-tion Erosion & runoff Siltation Buried substrate
Conceptual Model: Forces Changes Resources, System Components Target Condition A representation of relationships among natural and human forces and factors, that are believed to change, impact, influence, or lead to an target condition of specified resources.
Conceptual Models Conceptual models tell the story of “how the system works” and how restoration or other actions alter those processes or attributes of the system.
Benefits of Conceptual Models Express assumptions and understanding of the entire system Organize information concerning the components of the system Reduce the complexity of the problem Provide basis for communication and consensus building Describe links between stressors and affected ecological components
Mathematical Models • Identify and measure specific structural or functional criteria • Mathematically expression of the relationship of physical, chemical, and biological factors
What are basic considerations in selecting a method ? Type of available input data (e.g., GIS, field work, lab analysis) Output – unit of measure (e.g., 0-1 scale, # organisms) Desired assessment categories. (e.g., functions, biological integrity, socioeconomic) Habitat type Geographic area Time constraints (per site)?
Assessment objectives (refer method purpose) Is method suitable for specific applications? (e.g., impact analysis, establish compensation ratios, guide to design, inventory or planning) Construct of the method (pj, model based on population data, model based on structure) Does the method consider quality and quantity (acreage) Do you need an assessment method NOW? Other considerations:
Some of the Many Assessment Methods • ME Tidal Method • MN RAM • MT Form • NBM • NC-CREWS • NC Guidance • NEFWIBP • NH Method • NJ Watershed Method • OFWAM • PAM HEP • PFC • QHEI • Rapid Assess Methodology • Synoptic Approach • VIMS Method • WAFAM • WCHE • WET • WEThings • WHAMS • WHAP • WIRAM • WVA • WRAP • AREM • Coastal Method • CT Method • Descriptive App. • EPW • FQA • HAT • HEP • HGM Approach • Hollands-Magee • IBI • Interm HGM • IVA • Larson Method • MDE Method
Selecting an ecological assessment method- where do you look?
Sources for Methods • USGS databases • ECO-PCX • EMRIS (being phased out, but is on the Gateway) • Universities • EBM Tools • other state & federal agencies
Commonly Used Methods • Professional Judgment • Habitat Evaluation Procedure (HEP) • Hydro-geomorphic Approach (HGM) • Floristic Quality Assessment (FQA) • Index of Biological Integrity (IBI) Which can be used as input to Incremental Cost Analyses? Handout # 17 & 17a
Professional Judgment(A.K.A. Consult the Guru) • Simple statements • Function present or absent • Screening tool • Significant value when used by recognized expert • Narrative (usually cite literature or field experiences) • Rating (e.g., index, score 1-5, low, moderate, high)
Comments: Professional Judgment Advantages: • Usually rapid and cost effective. • May reveal things overlooked by other approaches. Disadvantages: • Generally lacks documentation to support rating. • Lack of criteria can leads to different scoring by different observers. • Less defensible. • Requires field experience to support credentials! • Observers with an agenda can influence answers! • Subject to manipulation! • Difficult to reproduce even if you use same experts!!
Habitat Evaluation Procedures (HEP) Provides a numerical index termed a Habitat Suitability Index or (HSI) incorporating food, water, cover and breeding relationships indicative of real estate’s (habitat) ability to support (carrying capacity) a given species or species. Handout #20 page 3
What is HEP? Biological Accounting System • Currency = Habitat Units (HU’s) • HUs = HSI X Acres
Method vs. Model Method → USFWS Habitat Evaluation Procedures Model → Habitat Suitability Index for Channel Catfish
How is Quality Derived? Qualityis measured as a Habitat Suitability Index or HSI which is derived from the measurement of limiting environmental factors called Life Requisites for a species or community.
Inventory and Forecast Conditions Food What are Life Requisites? Life Requisite Components Cover HSI X Area = HU Water Repro
What is an HSI? HSI= Habitat Suitability Index = Study Area Habitat Conditions Optimum Habitat Conditions Score= 0.0 to 1.0
How is Quantity Derived? Quantity = the number of acres of a cover type.
HUs vs. AAHUs HUs = gains/losses for a single Target Year AAHUs = gains/losses averaged over the life of the project
Key HEP Assumptions • Quantify habitat values. • Direct relationship between habitat and potential population. • Relationship expressed as an index.
Key HEP Assumptions • Habitat suitability is predictable. • Procedure was not designed to compare across evaluation elements (e.g., species, communities). • Not designed to compare across evaluation elements or species
Strengths: Objective Quantitative Standardized nationwide Models tested and available Can compare different habitats Limitations: Mostly based on habitat variables Can manipulate result by changing species Time consuming Does not address other functions. HEP Summary
HGM (Hydrogeomorphic Approach) Purpose: The HGM Approach utilizes reference wetlands as the means for establishing a scale, or index, against which other wetlands of the same type in a particular geographic area (reference domain) can be compared to determine their functional capacity. Handout #20 page 6-7
HGM (Hydrogeomorphic Approach) Habitats: Wetland Measures: Functional Capacity Units Units: FCI and FCU 1 FCI x 1 acre = 1 FCU Functional Capacity Index: An measure of how well study site functions compare to functions in reference wetlands of the region.
Method vs. Model Method → Hydrogeomprphic (HGM) Approach to Assessing Wetland Functions Model → Regional Guidebook for NW Gulf of Mexico Tidal Fringe Wetlands
Hydrogeomorphic Approach Overview • Developed to assess wetland functions in the 404 Regulatory Program • Focuses on regional wetland subclasses • This classification reduced variability and increased sensitivity. • Concept and construct is similar to HEP, but addresses several functions rather than life requisites. • Developed by the Corps of Engineers
Strengths: Objective Quantitative Several functions* Standardized nationwide Rapid once models ready Limitations: Model development time consuming Cannot compare different wetland classes Need to develop most models HGM Summary *The class exercise module focuses on nutrient cycling
FQA - Floristic Quality Assessment • Standardized tool used for site assessment of wetland floristic quality • Developed by Swink and Wilhelm for Chicago area* • Assesses the “conservatism” of plant species • Quality of area is reflectedby richness in conservativespecies *Plants of the Chicago Region, by Floyd Swink and Gerould Wilhelm, Indiana Academy of Science, 1994
FQA-Floristic Quality Assessment • Uses Coefficients of Conservatism • 9-10 Native, high fidelity, threatened • 7-8 Native, stable climax condition • 4-6 Native, early successional • 1-3 Native, widespread • 0 Native, opportunistic invader • 0 Alien, noxious invader • and number of species to determine the Floristic Quality Index (FQI)
Determining the Floristic Quality Index (FQI) • Compile a list of plants in the area • Assign coefficients of conservation to each • Determine the mean coefficient value of the area • Multiply the mean coefficient by the square root of the total number of native species • The product is the Floristic Quality Assessment Index or FQI • FQI = R / N • R= sum of Conservation Coefficients • N= number of native plants recorded
Method vs. Model Method → Floristic Quality Assessment Model → Coefficients of Conservatism for Vascular Plants of North and Central Mississippi
Illinois Wisconsin Michigan Missouri Indiana Kentucky Mississippi Northern Ohio Iowa North Dakota South Dakota West Virginia States with Coefficients of Conservation Lists
FQA Process • Convert FQI to a 0-1 scale and multiple by acres • Some say FQA incorporates size because plants with high conservatism coefficient will only be found in larger sites. (not always true) • Software available from Conservation Design Forum* *www.cdfinc.com
FQA Summary • Limitations: • Assignment of Coefficients is subjective • Coefficients can be regional in nature. Strengths: • Provides quantitative and uniform set of measurements • Allows for comparison of quality among many sites and for tracking changes over time • Availability of data
IBI –Index of Biotic Integrity • Multi-metric index for designed to measure the aquatic vertebrate community and surrounding conditions using aquatic species as indicators • Popular biological indicator of watershed health • Original index developed for Central IN and IL (Karr 1981) • Different versions were developed for different regions and ecosystems
IBI (Index of Biotic Integrity) Habitats: streams, mud flats, wetlands, and deepwater habitats Measures: biological integrity Units: IBI IBI = sum of metric* scores * A parameter with predictable and empirical patterns when plotted against a gradient disturbance.
IBI –Index of Biotic Integrity • Original Index included 12 Metrics in 5 Categories • Species Richness • Indicator Species • Trophic Function • Reproduction Function • Each metric is scored based on comparison of sampled site with reference site • Maximum score of 5 for each metric and scores are totals
Method vs. Model Method → Index of Biotic Integrity Model → An Estuarine Benthic Index of Biotic Integrity for the Mid-Atlantic Region
Different Assemblages Amphibians Fish Vascular Plants Birds Macroinvertebrates Algae
Example of Multiple Metrics A B Wisconsin IBI
Strengths: Direct measurement of biological integrity. Accounts for multiple stressors. Helps to diagnose stressor(s) impacting biota. Accounts for multiple measures of community attributes. Good existing condition information. Limitations: Not good at future predictions Not directly correlated to habitat variables or physical conditions. Non-biological functions not assessed (e.g. flood storage). Time consuming. Cannot compare different habitat types. Scores are geographically specific IBI
Model Certification Mandatory for any model or analytic tool used in the planning process. Information Quality Act (PL106-544) 2001 Implemented by EC 1105-2-412 Jan 09 Policy Guidance CECW-CP letter of 13 Aug 2008 Policy Guidance Memo on Certification of Ecosystem Output Models, Aug 08 EXEMPT: CAP* projects *CECW-P 19 Jan 2011 CAP Process Improvements
Model Certification Criteria Models should: Be technically sound and computationally correct. Be based on validated (verified) and accepted “state of the art” theory Incorporate Corps’ policies and requirements Properly incorporate conceptual theory into computer code Define assumptions inherent in model