Download
1 / 18
180 likes | 341 Vues
Diagrams of CAPM. Chapter 10 figures. Investors need only two funds. Figures 10.4, 10.5, and 10.6. Correlation coefficient. Portfolio variance. In terms of the correlation coefficient. MV. MV. MV. Diversification, minimum variance. B. E(R). A. s. The case of r = 1.

E N D
Diagrams of CAPM Chapter 10 figures
Investors need only two funds. • Figures 10.4, 10.5, and 10.6.
Portfolio variance In terms of the correlation coefficient
MV MV MV Diversification, minimum variance B E(R) A s
MV MV MV Diversification, minimum variance B E(R) A s
MV Diversification with a risk-free asset B E(R) A= risk-free asset s
. Y . X Capital Market Line Expected returnof portfolio Indifference curve Capital market line . preferred . M . . Risk-freerate (Rf ) Standarddeviation ofportfolio’s return.
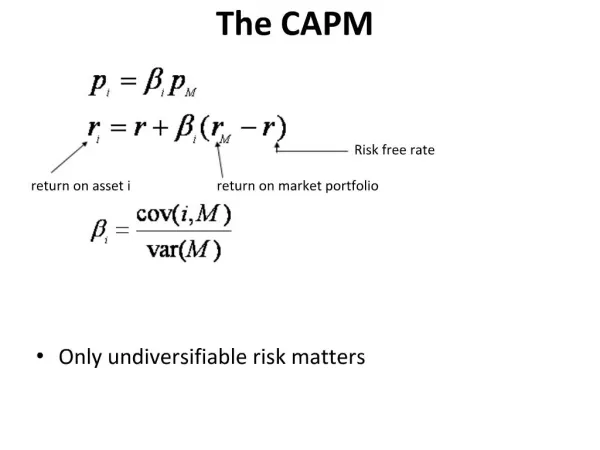
Argument for the security market line • Only beta matters • A mix of T-Bills and the market can produce any beta. • An asset with that beta is no better or worse than the two-fund counterpart • Hence it has the same return.
. T . S 0.8 Security Market Line T is undervalued. Its price rises Expected returnon security (%) Security market line (SML) . . . . Rm M Rf S is overvalued. Its price falls Beta ofsecurity 1