Download
1 / 57
570 likes | 597 Vues
Explore the principles governing population growth & sustainability, focusing on human population dynamics, limits to growth, density, distribution, population size determination, and various factors affecting population growth.

E N D
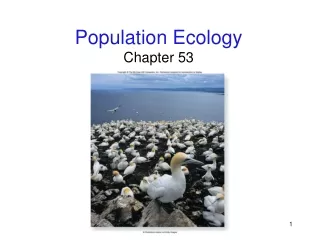
Population Ecology Certain ecological principles govern the growth and sustainability of all populations--including human populations
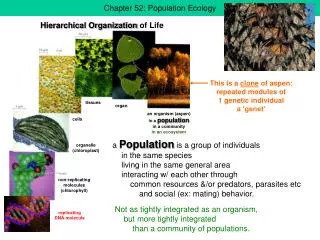
Population • A group of individuals of the same species occupying a given area • Can be described by demographics • Vital statistics such as size, density, distribution, and age structure
Human Population Growth • Population now exceeds 6 billion • Rates of increase vary among countries • Average annual increase is 1.26 percent • Population continues to increase exponentially
Limits to Growth • A population’s growth depends on the resources of its environment • Deer introduced to Angel Island • Population outstripped resources
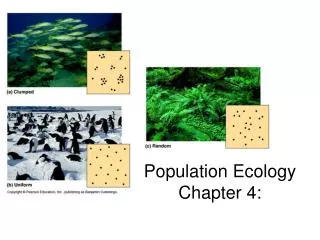
clumped nearly uniform random Fig. 45-2a, p.802
Density & Distribution • Number of individuals in some specified area of habitat • Crude density information is more useful if combined with distribution data clumped nearly uniform random Fig. 45-2a, p.802
Determining Population Size • Direct counts are most accurate but seldom feasible • Can sample an area, then extrapolate • Capture-recapture method is used for mobile species
Capture-Recapture Method • Capture, mark, and release individuals • Return later and capture second sample • Count the number of marked individuals and use this to estimate total population
Assumptions in Capture-Recapture • Marking has no effect on mortality • Marking has no effect on likelihood to being captured • There is no immigration or emigration between sampling times
Changes in Population Size • Immigration adds individuals • Emigration subtracts individuals • Births add individuals • Deaths subtract individuals
Zero Population Growth • Interval in which number of births is balanced by number of deaths • Assume no change as a result of migration • Population size remains stable
Per Capita Rates • Rates per individual • Total number of events in a time interval divided by the number of individuals • Per capita birth rate per month = Number of births per month Population size
Exponential Growth • Population size expands by ever increasing increments during successive intervals • The larger the population gets, the more individuals there are to reproduce Fig. 45-5a, p.804
Effect of Deaths • Population grows exponentially as long as per capita death rates are lower than per capita birth rates 25% mortality between divisions Fig. 45-6, p.804
Biotic Potential • Maximum rate of increase per individual under ideal conditions • Varies between species • In nature, biotic potential is rarely reached
Limiting Factors • Any essential resource that is in short supply • All limiting factors acting on a population dictate sustainable population size
Carrying Capacity (K) • Maximum number of individuals that can be sustained in a particular habitat • Logistic growth occurs when population size is limited by carrying capacity
Logistic Growth • As size of the population increases, rate of reproduction decreases • When the population reaches carrying capacity, population growth ceases
Logistic Growth Graph initial carrying capacity new carrying capacity Fig. 45-8, p. 807
Overshooting Capacity • Population may temporarily increase above carrying capacity • Overshoot is usually followed by a crash; dramatic increase in deaths Reindeer on St. Matthew’s Island Fig. 45-9, p.807
Density-Dependent Controls • Logistic growth equation deals with density-dependent controls • Limiting factors become more intense as population size increases • Disease, competition, parasites, toxic effects of waste products
Density-Independent Controls • Factors unaffected by population density • Natural disasters or climate changes affect large and small populations alike
Life History Patterns • Patterns of timing of reproduction and survivorship • Vary among species • Summarized in survivorship curves and life tables
Life Table • Tracks age-specific patterns • Population is divided into age categories • Birth rates and mortality risks are calculated for each age category
Survivorship Curves Graph of age-specific survivorship Figure 45.11 Page 809
Predation and Life History • Guppy populations vary in life history characteristics and morphology • Differences have genetic basis • Variation seems to be result of directional selection by predators
GUPPY FROM A KILLFISH STREAM Fig. 45-12a1, p.810
GUPPY FROM A PIKE-CICHLID STREAM Fig. 45-12b1, p.810
Human Population Problems • Over 6 billion people alive • About 2 billion live in poverty • Most resources are consumed by the relatively few people in developed countries
Side-Stepping Controls • Expanded into new habitats • Agriculture increased carrying capacity; use of fossil fuels aided increase • Hygiene and medicine lessened effects of density-dependent controls
Estimated size by 10,000 years ago 5 million By 1804 1 billion By 1927 2 billion By 1960 3 billion By 1974 4 billion By 1987 5 billion By 1999 6 billion Projected for 2050 8.9 billion domestication of plants, animals 9000 B.C. (about 11,000 years ago) beginning of industrial, scientific revolutions agriculturally based urban societies Fig. 45-15, p.813
Future Growth • Exponential growth cannot continue forever • Breakthroughs in technology may further increase carrying capacity • Eventually, density-dependent factors will slow growth
Fertility Rates • Worldwide, average annual rate of increase is 1.26% • Total fertility rate (TFR) is average number of children born to a woman • Highest in developing countries, lowest in developed countries
Population Age Structure • Divide population into age categories • Population’s reproductive base includes members of the reproductive and pre-reproductive age categories
Age Structure Diagrams Show age distribution of a population Negative Growth Slow Growth Zero Growth Rapid Growth
Population Momentum • Lowering fertility rates cannot immediately slow population growth rate • Why? There are already many future parents alive • If every couple had just two children, population would still keep growing for another 60 years