Class 4: Neurons BOLD
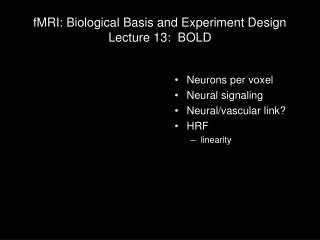
Class 4: Neurons BOLD. 2012 spring fMRI: theory & practice. Stimulus to BOLD. Source: Arthurs & Boniface, 2002, Trends in Neurosciences. BOLD signal. Source: Doug Noll ’ s primer. Neuron BOLD?. Raichle, 2001, Nature. Vasculature. Source: Menon & Kim, TICS.

Class 4: Neurons BOLD
E N D
Presentation Transcript
Class 4: Neurons BOLD 2012 spring fMRI: theory & practice
Stimulus to BOLD Source: Arthurs & Boniface, 2002, Trends in Neurosciences
BOLD signal Source: Doug Noll’s primer
Neuron BOLD? Raichle, 2001, Nature
Vasculature Source: Menon & Kim, TICS
Macro- vs. micro- vasculature Macrovasculature:vessels > 25 m radius(cortical and pial veins) linear and oriented cause both magnitude and phase changes Microvasculature:vessels < 25 m radius(venuoles and capillaries) randomly oriented cause only magnitude changes Capillary beds within the cortex.
Post-Synaptic Potentials • The inputs to a neuron (post-synaptic potentials) increase (excitatory PSPs) or decrease (inhibitory PSPs) the membrane voltage • If the summed PSPs at the axon hillock push the voltage above the threshold, the neuron will fire an action potential
Even Simple Circuits Aren’t Simple gray matter(dendrites, cell bodies & synapses) Lower tier area (e.g., thalamus) Will BOLD activation from the blue voxel reflect: • output of the black neuron (action potentials)? • excitatory input (green synapses)? • inhibitory input (red synapses)? • inputs from the same layer (which constitute ~80% of synapses)? • feedforward projections (from lower-tier areas)? • feedback projections (from higher-tier areas)? white matter (axons) Middle tier area (e.g., V1, primary visual cortex) Higher tier area (e.g., V2, secondary visual cortex) …
Figure 6.15 The change in diameter of arterioles following sciatic stimulation
Figure 6.16 Change in arteriole dilation as a function of distance from active neurons
Figure 7.12 Relative changes in cerebral blood flow and cerebral blood volume following neuronal activity
BOLD Correlations Local Field Potentials (LFP) • reflect post-synaptic potentials • similar to what EEG (ERPs) and MEG measure Multi-Unit Activity (MUA) • reflects action potentials • similar to what most electrophysiology measures Logothetis et al. (2001) • combined BOLD fMRI and electrophysiological recordings • found thatBOLD activity is more closely related to LFPs than MUA Source: Logothetis et al., 2001, Nature
Deoxygenated Blood Signal Loss Oxygenated blood? No signal loss… Deoxygenated blood? Signal loss!!! Images from Huettel, Song & McCarthy, 2004, Functional Magnetic Resonance Imaging
Figure 7.4 Changes in oxygenated and deoxygenated hemoglobin following neuronal stimulation
Summary of BOLD signal generation (A) under normal conditions, oxygenated hemoglobin (Hb) is converted to deoxygenated hemoglobin at a constant rate within the capillary bed. (B) But when neurons become active, the vascular system supplies more oxygenated hemoglobin than is needed by the neurons, through an over-compensatory increase in blood flow. This results in a decrease in the amount of deoxygenated hemoglobin and a corresponding decrease in the signal loss due to T2* effects, leading to a brighter MR image Figure Source, Huettel, Song & McCarthy, 2004, Functional Magnetic Resonance Imaging
Figure 7.11 Schematic representations of the BOLD hemodynamic response
Hemodynamic Response Function • % signal change • = (point – baseline)/baseline • usually 0.5-3% • initial dip • -more focal and potentially a better measure • -somewhat elusive so far, not everyone can find it • time to rise • signal begins to rise soon after stimulus begins • time to peak • signal peaks 4-6 sec after stimulus begins • post stimulus undershoot • signal suppressed after stimulation ends
Verb generation after 15 min practice Verb generation fMRI Measures the Population Activity • population activity depends on • how active the neurons are • how many neurons are active • manipulations that change the activity of many neurons a little have a show bigger activation differences than manipulations that change the activation of a few neurons a lot • attention • activity • learning • activity • fMRI may not match single neuron physiology results Raichle & Posner, Images of Mind cover image Ideas from: Scannell & Young, 1999, Proc Biol Sci
Comparing Electrophysiolgy and BOLD Data Source: Disbrow et al., 2000, PNAS Figure Source, Huettel, Song & McCarthy, Functional Magnetic Resonance Imaging
The Concise Summary We sort of understand this (e.g., psychophysics, neurophysiology) We sort of understand this (MR Physics) We’re *&^%$#@ clueless here!
Bottom Line • Despite all the caveats, questions and concerns, BOLD imaging is well-correlated with results from other methods • BOLD imaging can resolve activation at a fairly small scale (e.g., retinotopic mapping) • PSPs and action potentials are correlated so either way, it’s getting at something meaningful • even if BOLD activation doesn’t correlate completely with electrophysiology, that doesn’t mean it’s wrong • may be picking up other processing info (e.g., PSPs, synchrony)
PET vs. fMRI • fMRI does not require exposure to radiation • fMRI can be repeated • fMRI has better spatial and temporal resolution • requires less averaging • can resolve brief single events • MRI is becoming very common; PET is specialized • MRI can obtain anatomical and functional images within same session • PET can resolve some areas of the brain better • in PET, isotopes can tagged to many possible tracers (e.g., glucose or dopamine) • PET can provide more direct measures about metabolic processes