MetaCore data analysis suite and functional analysis
MetaCore data analysis suite and functional analysis. Knowledge Base: - protein interactions - causative associations (gene-disease, cpd-disease) - pathways, protein complexes - ontologies. Experimental data depository. Data analysis tools: EA, networks, interactome.

MetaCore data analysis suite and functional analysis
E N D
Presentation Transcript
Knowledge Base: • - protein interactions • - causative associations (gene-disease, cpd-disease) • - pathways, protein complexes • - ontologies Experimental data depository Data analysis tools: EA, networks, interactome “Knowledge-based” functional data analysis Cancer relevant annotations, datatabases, Active cpds analysis screening Data parsing, normalization HTS, HCS Targets Compound scoring Biomarkers
700,000 compounds w/targets • 4,000 endogenous metabolites • >20,000 ligand-receptor interactions • 850 GPCRs and other membrane receptors • Nuclear hormone receptors Ligands: metabolites, peptides, xenoboitics Membrane receptors Signal transduction: G proteins, Secondary messengers Kinases Phosphotases >200K manually curated physical signaling interactions 466 canonical maps 43,000 12-step canonical pathways 900 Human transcription factors 4100 target genes Transcription factors 11,000 metabolic reactions 110 Fine metabolic maps Core effect: metabolic pathways Metabolites 4,000 endogenous metabolites Knowledge base: Three interactions domains
Knowledge base: >100,000 biological pathways Pic.1 Ligand Receptor Second messenger Enzyme TF Ligand TF TF target Reaction metabolite Ligand Receptor Adaptor Enzyme TF TF target 5
Protein complexes/groups (species-specific) Protein structure map (group, complex or group of complexes) is shown on protein page Chosen protein highlighted
Pathways Integration • Networks of protein interactions • Dynamic; built “on-the-fly” • Exploratory tool • Build new pathways for genes of interest • Interactive, static maps • 400 maps • Signaling, regulation, metabolism, diseases • Backbone of formalized “state of art” in the field
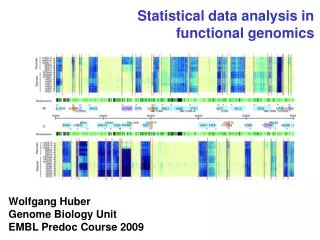
Concurrent visualization of different data types, experiments Agilent Affymetrix Proteomic SAGE
Types of biomarkers • Literature biomarkers • causative “gene-disease” relations • manually annotated • cover DNA, RNA, protein, • metabolites levels • used in multiple applications • “Basic” experimental biomarkers. • Sets of common genes, proteins for • multiple samples within a state • Easy to define • Flexible options • Low resolution • Not validated • Work for only few patients (<20) Biomarker is a substance used as an indicator of a biologic state Wikipedia Biomarkers Trust, utility • “Gene signature validation” • Large scale studies • Statistical models • Statistical clustering • Need validation studies • Long term and expensive • Poor in cross-platform • Poor robustness • No mechanism • Functional descriptors • Large scale studies • Statistical models • Functional clustering • Need validation studies • Long term and expensive • Validated cross-platform • High robustness • Mechanism
Functional analysis must run in parallel to statistical signatures. Why? Biological analysis: Networks, pathways, Statistics on functional categories Math on networks, AI ? Prioritized gene lists Genes are functionally connected Differentially expressed genes, proteins (normalization, QC) Statistical analysis, Gene signatures • Functional analysis: • Pathways, • Networks • Process ontology • Disease ontology • Toxicity ontology
Gene signatures usually don’t make functional sense. No concise networks 70-genes metastases signature t’Veer: DI network van 'T Veer L. J., Dai H, van de Vijer, M.J., , He Y.D., et al, Gene expression profiling predicts clinical outcome of breast cancer. Nature, 2002, 415, 530-36 Wang Y. et al. Gene-expression profiles to predict distant metastasis of lymph-node-negative primary breast cancer. Lancet, 2005, 365, 671-79
76-genes metastases signature Wang: DI network Gene signatures usually don’t make functional sense. No concise networks van 'T Veer L. J., Dai H, van de Vijer, M.J., , He Y.D., et al, Gene expression profiling predicts clinical outcome of breast cancer. Nature, 2002, 415, 530-36 Wang Y. et al. Gene-expression profiles to predict distant metastasis of lymph-node-negative primary breast cancer. Lancet, 2005, 365, 671-79
“Knowledge-based” functional analysis Cross-reference P-values • Enrichment by category: • Signaling processes • Metabolic processes • Diseases • Toxicities • Networks • Based on binary interactions • Multiple algorithms • Filers for specificity Match IDs Match IDs • Parsed data: • -Gene IDs (LLs, GeneBank) • Protein IDs (Uniprot) • Compound IDs (CAS, smiles) Match IDs • “Canonical” pathways • Signaling and metabolic pathways • Linear, 12-13 steps • “vertical” from MR to TF to effect
Top canonical maps for two signatures for same condition (metastases in invasive breast cancers). Not comparable Wang V’teer
Functional analysis tools Resolution • Enrichment analysis for gene, protein, compound sets • Hyper G, GSEA, GSA etc. • Multidimensional analysis: multiple ontologies • GO processes • GG processes • Canonical pathways • Diseases • Export of sub-sets for network analysis • Low resolution • Experiment filters • Species, orthologs, localizations, tissues etc. • Custom list of targets, IDs 1000 genes; Multiple sets • Interactome analysis • Whole-set analysis • Over- and underconnected nodes in the dataset • Interactions neighborhood • TFs, kinases, receptors, etc. • Scoring for interactions within set: FDR • Network analysis • Multiple pre-filters (species, interactions mechanisms, organelles etc.) • Parameters: enrichment with genes from set, canonical pathways, specific protein classes • Algorithms: SP, DI, AN, TFs, Receptors etc. • Statistics: hubs, preferred pathways etc. • Highest resolution: individual proteins or isoforms “Most important” genes - Highly connected TFs, receptors, etc. • Hubs from important networks • Highest expressed/mutated genes
Interactome analysis A B P21: 206 interactions in 16,000 proteins db All proteins in the database Amplicome Mutome • Calculates local and global connectivity • for arbitrary datasets and lists: • Intra-connectivity within set • Inter-connectivity • Between sets • Between set and all proteins in database Under-connection Expectation Over-connection 3 interactions for P21 P21: expect 5 interactions in 320 proteins dataset 9 interactions for P21
Data workflow • Epigenetics • Methylation • Histones • Nucleosomes Signaling DNA Germline abberations Somatic mutations Amplifications Deletions RNA • Gene expression: • mRNA: abundance, splice • variants • miRNA • Protein changes: • Mutated • PTMs Effect Protein • Metabolites: • Major misbalances • Energy • Protein synthesis • Metabolic ligands Metabolites
Interactome analysis A B P21: 206 interactions in 16,000 proteins db All proteins in the database Amplicome Mutome • Calculates local and global connectivity • for arbitrary datasets and lists: • Intra-connectivity within set • Inter-connectivity • Between sets • Between set and all proteins in database Under-connection Expectation Over-connection 3 interactions for P21 P21: expect 5 interactions in 320 proteins dataset 9 interactions for P21 22
Functional synergy in enrichment analysis Dataset 1 Dataset 2 Non-redundant union EA in ontology: KEGG, GO, GeneGo pathways, disease biomarkers etc.. Pathway 1: p-value 3.2e-4 Pathway 2: 5.1e-3 …. Pathway 1: p-value 5e-3 Pathway 2: 2e-2 …. Pathway 1: p-value 2.1e-2 Pathway 2: 2.5e-1 …. Unconnected datasets Pathway 1: p-value 4e-8 Pathway 2: 1.2e-7 …. Synergistic datasets 25
DM data parsers • Custom interactions data: • Y2H • Pull-down • Co-expression • annotation Structures sdf, MOL HTS, HCS Metabolites Gene lists Custom maps, networks, pathways Molecular bio data ISIS DB HTS, HCS Structure parser MetaLink Pathway Editor MapEditor General parser Metabolic parser
Batch upload: Browse files in • 2. Click ‘Next»’ • 1. Browse in file to upload. For batch upload, choose zip archive files
Results management • Analysis results saved in different formats: • - Gene lists • - Network object lists • - Workflows • - Network lists • - Networks • - Netshots • - New maps • Hierarchical folders structure • One-button activation of experiments • Graphics saved in up to 300dpi format • (“cover” publication quality)
Data export • Experiments • Gene lists • Network object lists • Excel or Word or text formats
Cancer-related Diseases and Maps +Distributions by GO terms Ontologies that contain specified targets will be emphasized with green font
Network are built and saved to report and to the “workflows” folder in the Data Manager. Network statistics are generated and reported for common, similar, and unique genes.
MetaSearch™ overview • Flexible way to extract data from MetaCore/MetaDrug Discovery Platform (MetaDiscovery) • Real-time communication with MetaDiscovery™ tools • Results can be visualized and analyzed in MetaCore™ and MetaDrug™
26. As a result we obtain a list of 27 chemicals (from over600 000chemicals from the database), that satisfy our conditions – Interact with human beta 2 adrenoreceptor, activating it at less than 100 nM concentrations
MapEditor Lite/MetaMap AFTER BEFORE Wet lab research, Writing reviews Minutes Hours Days? Weeks?
MapEditor Additional Localizations can be added
Your NEW map is now an interactive part of MetaCore Users can visualize their experimental data on the new map