Download
1 / 55
550 likes | 720 Vues
One-way Analysis of Variance and Post Hoc Tests. Key Points about Statistical Test Sample Homework Problem Solving the Problem with SPSS Logic for One-way Analysis of Variance with Post Hoc Tests Power Analysis. One-way Analysis of Variance: Purpose.

E N D
One-way Analysis of Variance and Post Hoc Tests Key Points about Statistical Test Sample Homework Problem Solving the Problem with SPSS Logic for One-way Analysis of Variance with Post Hoc Tests Power Analysis
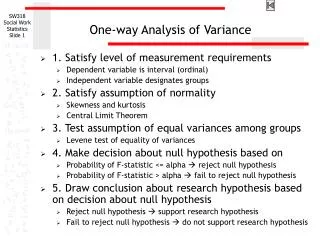
One-way Analysis of Variance: Purpose • Purpose: test whether or not the populations represented by the samples have a different mean • Examples: • Social work students have higher GPA’s than nursing students and education majors • Social work students volunteer for more hours per week than education majors, liberal arts majors, and communications majors • UT social work students score higher on licensing exams than graduates of Texas State University, Baylor University, and University of Houston
One-way Analysis of Variance: Hypotheses - 1 • Hypotheses: • Null: mean of population 1 = mean of population 2 = mean of population 3 = mean of population 4 …. Versus • Research: at least one population mean is different from the others • Decision: • Reject null hypothesis if pSPSS ≤ alpha (≠ relationship)
One-way Analysis of Variance: Hypotheses - 2 • A significant finding tells us that at least one mean is different from the other, but it does not tell us which one or ones differ. • To answer that question, we might try to use t-tests to compare each of the pairs of means to identify which are significantly different. However, the multiple tests would increase the probability of making a Type I error increases above the alpha that we set, i.e. greater than the risk of drawing a wrong conclusion. • One strategy for controlling the error rate is the Bonferroni inequality by which we divide alpha by the number of tests we need and only report those that meet this reduced level of significance.
One-way Analysis of Variance: Hypotheses - 3 • As an alternative, statisticians have developed post hoc tests which control the error rate for the number of comparisons that are made. • Thus, for a one-way analysis of variance, we only report findings for combinations of differences if the main test (often referred to as the omnibus test) shows statistical significance. • We will use the Tukey HSD (Honestly Significant Difference) test to identify statistically significant differences between pairs of groups.
One-way Analysis of Variance: Assumptions and Requirements • Variable is interval level (ordinal with caution) • Variable is normally distributed • Acceptable degree of skewness and kurtosis or • Using the Central Limit Theorem (10+ in each group) • The variance of the groups is not different
One-way Analysis of Variance: Effect Size - 1 • For analysis of variance, the effect size statistic, there are multiple measures of effect size: • eta squared (η²), • partial Eta squared (ηp²), • omega squared (ω²), and • the Intraclass correlation (ρI) • We are particularly interested in eta squared which is the percent of the total variance in the dependent variable accounted for by the variance between categories (groups) defined by the independent variable, i.e. the ratio of the between-groups sum of squares to the total sum of squares.
One-way Analysis of Variance: Effect Size - 2 • The effect size statistic used in power analysis is f, which is computed as the square root of η² ÷ 1 + η² • Cohen’s interpretation of f: • small: f = .10 to .25 • medium: f = .25 to .40 • large: f = .40 and higher
One-way Analysis of Variance: APA Style - 1 • An One-way Analysis of Variance is presented as: F(2,97) = 5.819, p = .004 , η² = .35 • Example: The results indicated a significance difference at the .004 level in patient improvementunder three different therapeutic personality type as established by the Handerson Therapeutic Personality Measurement. F (2,97) = 5.819, p = .004. Effect size if available Between groups degrees of freedom Within groups degrees of freedom Value of statistic Significance of statistic
One-way Analysis of Variance: APA Style - 2 • Reporting results of a post hoc test: A Tukey HSD posthoc was conducted finding a significance difference in improvement in borderline patients between those seeing a directive therapist and a relational therapist, p = .003. The greatest improvement was found among patients in the directive group (M = .53, SD = .0072) which was significantly greater than the improvement found in the relational group(M = .48, SD = .014). The non-directive sample fell in between these two with a mean of .51( M = .51, SD = .009) and was not statistical significant from either the relational or the directive group means.
Homework problems: One-way Analysis of Variance This problem uses the data set GSS2000R.Sav to compare the average score on the variable "highest year of school completed" [educ] for groups of survey respondents defined by the variable "subjective class identification" [class]. Using a one-way analysis of variance and a post hoc test with an alpha of .05, is the following statement true, true with caution, false, or an incorrect application of a statistic? Survey respondents who said they belonged in the working class completed fewer years of school (M = 12.58, SD = 2.50) than survey respondents who said they belonged in the middle class (M = 13.83, SD = 3.14). • True • True with caution • False • Incorrect application of a statistic This is the general framework for the problems in the homework assignment on “One-way Analysis of Variance and Post Hoc Tests.” The description is similar to findings one might state in a research article.
Homework problems: One-way Analysis of Variance - Data set, variables, and sample This problem uses the data set GSS2000R.Sav to compare the average score on the variable "highest year of school completed" [educ] for groups of survey respondents defined by the variable "subjective class identification" [class]. Using a one-way analysis of variance and a post hoc test with an alpha of .05, is the following statement true, true with caution, false, or an incorrect application of a statistic? Survey respondents who said they belonged in the working class completed fewer years of school (M = 12.58, SD = 2.50) than survey respondents who said they belonged in the middle class (M = 13.83, SD = 3.14). • True • True with caution • False • Incorrect application of a statistic • The first paragraph identifies: • The data set to use, e.g. GSS2000R.Sav • The groups that will be compared in the analysis • The variable compared in the one-way Anova • Thealpha level to use for the hypothesis test
Homework problems: One-way Analysis of Variance – Specific Relationship Tested This problem uses the data set GSS2000R.Sav to compare the average score on the variable "highest year of school completed" [educ] for groups of survey respondents defined by the variable "subjective class identification" [class]. Using a one-way analysis of variance and a post hoc test with an alpha of .05, is the following statement true, true with caution, false, or an incorrect application of a statistic? Survey respondents who said they belonged in the working class completed fewer years of school (M = 12.58, SD = 2.50) than survey respondents who said they belonged in the middle class(M = 13.83, SD = 3.14). • True • True with caution • False • Incorrect application of a statistic • The second paragraph specifies: • The specific groups compared in the post hoc test • The sample means and standard deviation for the groups being compared
Homework problems: One-way Analysis of Variance – Choosing an answer The answer to a problem will be True with caution if the analysis supports the finding in the problem statement, but the dependent variable is ordinal level. The answer to a problem will be True if the Anova and Post Hoc Test supports the finding in the problem statement. This problem uses the data set GSS2000R.Sav to compare the average score on the variable "highest year of school completed" [educ] for groups of survey respondents defined by the variable "subjective class identification" [class]. Using a one-way analysis of variance and a post hoc test with an alpha of .05, is the following statement true, true with caution, false, or an incorrect application of a statistic? Survey respondents who said they belonged in the working class completed fewer years of school (M = 12.58, SD = 2.50) than survey respondents who said they belonged in the middle class (M = 13.83, SD = 3.14). • True • True with caution • False • Incorrect application of a statistic The answer to a problem will be False if the analysis meets the requirements but does not support the finding in the problem statement. • The answer to a problem will Incorrect application of a statistic if • the analysis violates the level of measurement requirement, i.e. the dependent variable is nominal/dichotomous level • the assumption of normality is violated and the central limit theorem cannot be applied
Solving the problem with SPSS:Level of measurement - 1 In a one-way analysis of variance, the level of measurement for the independent can be any level that defines groups (dichotomous, nominal, ordinal, or grouped interval) and the dependent variable is required to be interval level. "Subjective class identification" [class] is ordinal satisfying the requirement for the independent variable.
Solving the problem with SPSS:Level of measurement - 2 The dependent variable "highest year of school completed" [educ] is interval level satisfying the requirement for the dependent variable.
Solving the problem with SPSS: Evaluating normality - 1 The one-way analysis of variance compares group means and requires that the dependent variable be normally distributed. We will generate descriptive statistics to evaluate normality. Select the Descriptive Statistics > Descriptives… command from the Analysis menu.
Solving the problem with SPSS: Evaluating normality - 2 First, move the variable we will use in the t-test, educ, to the Variable(s) list box. Second, click on the Options… button to select the statistics we want.
Solving the problem with SPSS: Evaluating normality - 3 First, in addition to the statistics, SPSS has checked by default, mark the Kurtosis and Skewness check boxes on the Distribution panel. Second, click on the Continue button to close the dialog box.
Solving the problem with SPSS: Evaluating normality - 4 Click on the OK button to obtain the output.
Solving the problem with SPSS: Evaluating normality - 5 "Highest year of school completed" [educ] did not satisfy the criteria for a normal distribution. The skewness of the distribution (-.137) was between -1.0 and +1.0, but the kurtosis of the distribution (1.246) fell outside the range from -1.0 to +1.0. Having failed the normality requirement using this criteria, we will see if we can apply the central limit theorem by examining the size of each group in the independent variable.
Solving the problem with SPSS: One-way analysis of variance - 1 The number of cases in each group is part of the output for the one-way Anova, so we will go ahead and compute that test to continue addressing the issue of normality. Select Compare Means > One-Way ANOVA… from the Analyze menu.
Solving the problem with SPSS: One-way analysis of variance - 2 First, move the dependent variable educ to the Test Variable(s) list box. Second, move the independent variable class to the Grouping Variable text box. Third, click on the Post Hoc button to select the tests to compare pairs of means.
Solving the problem with SPSS: One-way analysis of variance - 3 First, we mark the checkboxes for the Tukey HSD test and the Games-Howell test. We will choose which one of these we interpret based on the results of the test of homogeneity of variance. Second, if the level of significance were different than the default of .05, we would change it here. Third, click on the Continue button to close the dialog box.
Solving the problem with SPSS: One-way analysis of variance - 4 Next, we click on the options test to specify additional output.
Solving the problem with SPSS: One-way analysis of variance - 5 Second, click on the Continue button to close the dialog box. First, we mark the check boxes for Descriptive statistics and for the Homogeneity of variance test.
Solving the problem with SPSS: One-way analysis of variance - 6 Having provided the specifications for the analysis, we click on the OK button to request the output.
Solving the problem with SPSS: Evaluating normality with the central limit theorem - 7 Since each class group had more than 10 members, we are able to satisfy the normality assumption with the Central Limit Theorem. If we are unable to establish normality either by the distribution or by the central limit theorem, a one-way Anova would not be an appropriate statistic.
Solving the problem with SPSS:Evaluating equality of group variances The probability associated with Levene's Test for Equality of Variances (p=0.038) is less than or equal to alpha of .05. The assumption of equal variances on the dependent variable across groups defined by the independent variable is not satisfied. However, the analysis of variance is robust to violations of this assumption, and we can base the interpretation of post hoc differences on Games and Howell's modification of Tukey's HSD. The Games-Howell post hoc test adjusts for violations of the homogeneity of variance assumption.
Solving the problem with SPSS: Answering the question - 1 The finding we are trying to verify is: Survey respondents who said they belonged in the working class completed fewer years of school (M = 12.58, SD = 2.50) than survey respondents who said they belonged in the middle class (M = 13.83, SD = 3.14). We first check the significance of the F-test to make certain there are overall differences among groups. The probability of the Anova test statistic was less than or equal to the alpha level of significance of .05 (F(3, 264) = 4.97, p < .01). The null hypothesis that the mean "highest year of school completed" is the same for all groups defined by the variable "subjective class identification" [class] is rejected.
Solving the problem with SPSS: Answering the question - 2 The finding we are trying to verify is: Survey respondents who said they belonged in the working class completed fewer years of school (M = 12.58, SD = 2.50) than survey respondents who said they belonged in the middle class (M = 13.83, SD = 3.14). Based on the Games-Howell post hoc test, the difference in the mean for survey respondents who said they belonged in the working class (12.58) and the mean for survey respondents who said they belonged in the middle class (13.83) was 1.25, a statistically significant difference at the 0.05 level of significance.
Solving the problem with SPSS: Answering the question - 3 The means and standard deviations cited in the problem statement are correct. The statement that "survey respondents who said they belonged in the working class completed fewer years of school (M = 12.58, SD = 2.50) than survey respondents who said they belonged in the middle class (M = 13.83, SD = 3.14)" is correct. The answer to the question is True.
Logic for one-way analysis of variance:Level of measurement Measurement level of independent variable? Any level defining groups Measurement level of dependent variable? Nominal/ Dichotomous Interval/ordinal Strictly speaking, the test requires an interval level variable. We will allow ordinal level variables with a caution. Inappropriate application of a statistic
Logic for one-way analysis of variance:Assumption of normality If each group contains 10 or more cases, we apply the Central Limit Theorem. Number of cases in each group is at least 10? Skewness and Kurtosis between -1.0 and +1.0? No No Inappropriate application of a statistic Yes Yes
Logic for One-way ANOVA:Assumption of equality of variances Probability for Levene test of homogeneity of population variances less than or equal to alpha? Yes No Interpret ‘Games-Howell’ Post Hoc Test Interpret ‘Tukey HSD’ Post Hoc Test
Logic for one-way analysis of variance: Decision about null hypothesis Probability for F-test less than or equal to alpha? Yes No False
Logic for one-way analysis of variance: Decision about post hoc test Probability of post hoc test for the specified comparison ≤ alpha? Yes No Direction of relationship, means, and standard deviations correctly stated? False Yes No Add caution for ordinal variable. True False
Power Analysis: One-way ANOVA Problem that was False This problem uses the data set GSS2000R.Sav to compare the average score on the variable "occupational prestige score" [prestg80] for groups of survey respondents defined by the variable "respondent's degree of religious fundamentalism" [fund]. Using a one-way analysis of variance and a post hoc test with an alpha of .01, is the following statement true, true with caution, false, or an incorrect application of a statistic? Survey respondents who said they were religiously fundamentalist had less prestigious occupations (M = 42.64, SD = 13.40) than survey respondents who said they were religiously moderate (M = 43.92, SD = 13.62). 1 True 2 True with caution 3 False 4 Incorrect application of a statistic The answer to this problem was false because the probability for the t-test was . 476 (one-tailed), greater than the alpha of 0.01. We can conduct a post-hoc power analysis to determine if the number of available cases was needed to find a statistically significant difference.
Power Analysis: Statistical Results for False One-way ANOVA - 1 The answer to the problem was false because the one-tailed significance was p = .29 (.583 ÷ 2), greater than the alpha of .05.
Power Analysis: Statistical Results for False One-way ANOVA - 2 To calculate the effect size, and corresponding power, for this problem, we need a pooled estimate of the standard deviation for the two groups. SamplePower will calculate that for us, we will enter the sample sizes, means, and standard deviations for the two groups in SamplePower.
Access to SPSS’s SamplePower Program The UT license for SPSS does not include SamplePower, the SPSS program for power analysis. However, the program is available on the UT timesharing server. Information about access this program is available at this site.
Power Analysis for One-way ANOVA - 1 In the SamplePower program on the ITS Timesharing Systems, select the New… command from the File menu.
Power Analysis for One-way ANOVA - 2 First, select the Means tab to access the tests for means. Third, click on the Ok button to enter the specific values for our problem. Second, since we want to enter the means for our two groups, select the option button for t-test for 2 (independent) groups with common variance (Enter means)
Power Analysis for One-way ANOVA - 3 Position the mouse cursor over the entry for number of levels (2). The cursor will change from an arrow to a crosshair. Click on the number 2 to open the dialog box for entering means and standard deviation.
Power Analysis for One-way ANOVA - 4 Click the up arrow button on the spinner to change the Number of categories in this factor to 3.
Power Analysis for One-way ANOVA - 5 First, click on the tab Enter SD to enter the Between Groups variance. Second, enter the Between Groups variance (147.28) from the ANOVA table.
Power Analysis for One-way ANOVA - 6 First, click on the tab Enter Means to enter means for the three groups. Second, type the means for the three groups from the ANOVA output: 42.63, 43.92, and 45.49.
Power Analysis for One-way ANOVA - 7 To compute the effect size statistic, f, for ANOVA problems, click on the Compute f button. Note: the effect size f is not the same as the F-ratio statistic in the ANOVA table.
Power Analysis for One-way ANOVA - 8 Note: this is the effect size f based on the entries thus far. Since we still have more information to enter, the actual f will change. When you click on the yellow Compute f button, it changes to a turquoise Register f button. When you click on the Register f button, the effect size f will be copied over to the main window and the dialog box will be closed.
Power Analysis for One-way ANOVA – 9 First, enter the Within Groups variance (197.89) from the ANOVA table. Second, click on the Compute button to update the calculations for effect size and power.