
Detroit High School Student Safety and Health Survey Findings
This report presents findings from the Detroit High School Survey that assessed various safety and health behaviors among students over the past 12 months. Key areas covered include the use of bicycle helmets, seat belt usage, incidents of riding with alcohol-impaired drivers, weapon carrying, feelings of safety at school, and experiences with violence and mental health. By analyzing responses across different grades and genders, this survey aims to provide a comprehensive overview of student behaviors and needs, helping to inform school policies and health initiatives.

Detroit High School Student Safety and Health Survey Findings
E N D
Presentation Transcript
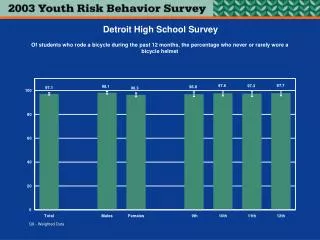
Detroit High School Survey Of students who rode a bicycle during the past 12 months, the percentage who never or rarely wore a bicycle helmet 97.7 97.6 97.3 98.1 96.8 97.1 96.3 100 80 60 40 20 0 Total Males Females 9th 10th 11th 12th Q8 - Weighted Data
Detroit High School Survey Percentage of students who never or rarely wear a seat belt when riding in a car driven by someone else 100 80 60 40 20 12.1 11.1 10.4 7.9 9.5 7.9 7.5 0 Total Males Females 9th 10th 11th 12th Q9 - Weighted Data
Detroit High School Survey Percentage of students who, during the past 30 days, rode one or more times in a car or other vehicle driven by someone who had been drinking alcohol 100 80 60 36.3 34.0 35.0 31.6 33.7 32.4 31.7 40 20 0 Total Males Females 9th 10th 11th 12th Q10 - Weighted Data
Detroit High School Survey Percentage of students who, during the past 30 days, drove a car or other vehicle one or more times when they had been drinking alcohol 100 80 60 40 20 8.2 7.5 5.3 5.3 5.5 5.4 2.7 0 Total Males Females 9th 10th 11th 12th Q11 - Weighted Data
Detroit High School Survey Percentage of students who carried a weapon such as a gun, knife, or club on one or more of the past 30 days 100 80 60 40 23.1 19.9 18.8 18.6 16.6 16.4 14.6 20 0 Total Males Females 9th 10th 11th 12th Q12 - Weighted Data
Detroit High School Survey Percentage of students who carried a gun on one or more of the past 30 days 100 80 60 40 13.1 20 8.3 7.1 7.3 7.0 7.8 2.9 0 Total Males Females 9th 10th 11th 12th Q13 - Weighted Data
Detroit High School Survey Percentage of students who carried a weapon such as a gun, knife, or club on school property on one or more of the past 30 days 100 80 60 40 20 9.0 9.1 9.5 8.4 8.7 8.0 6.9 0 Total Males Females 9th 10th 11th 12th Q14 - Weighted Data
Detroit High School Survey Percentage of students who did not go to school on one or more of the past 30 days because they felt unsafe at school or on their way to or from school 100 80 60 40 13.2 20 9.7 12.0 9.4 11.0 9.7 8.6 0 Total Males Females 9th 10th 11th 12th Q15 - Weighted Data
Detroit High School Survey Percentage of students who had been threatened or injured with a weapon such as a gun, knife, or club on school property one or more times during the past 12 months 100 80 60 40 13.4 12.3 20 10.3 10.3 10.9 8.4 8.4 0 Total Males Females 9th 10th 11th 12th Q16 - Weighted Data
Detroit High School Survey Percentage of students who have had property, such as their car, clothing, or books stolen or damaged on school property during the past 12 months 100 80 60 41.3 35.9 35.8 36.5 36.2 33.5 40 29.7 20 0 Total Males Females 9th 10th 11th 12th Q17 - Weighted Data
Detroit High School Survey Percentage of students who were in a physical fight one or more times during the past 12 months 100 80 60 51.0 50.9 44.9 42.9 35.7 31.8 29.7 40 20 0 Total Males Females 9th 10th 11th 12th Q18 - Weighted Data
Detroit High School Survey Percentage of students who were injured in a physical fight one or more times during the past 12 months and had to be treated by a doctor or nurse 100 80 60 40 20 5.4 5.2 4.3 3.7 4.0 3.0 2.6 0 Total Males Females 9th 10th 11th 12th Q19 - Weighted Data
Detroit High School Survey Percentage of students who were in a physical fight on school property one or more times during the past 12 months 100 80 60 40 27.0 26.6 19.5 20.5 14.9 13.1 11.9 20 0 Total Males Females 9th 10th 11th 12th Q20 - Weighted Data
Detroit High School Survey Percentage of students who were ever hit, slapped, or physically hurt on purpose by their boyfriend or girlfriend during the past 12 months 100 80 60 40 15.6 14.6 13.9 14.5 13.8 14.1 20 11.2 0 Total Males Females 9th 10th 11th 12th Q21 - Weighted Data
Detroit High School Survey Percentage of students who have ever been physically forced to have sexual intercourse when they did not want to 100 80 60 40 11.9 20 12.0 11.3 10.0 9.6 10.5 8.8 0 Total Males Females 9th 10th 11th 12th Q22 - Weighted Data
Detroit High School Survey Percentage of students who, during the past 12 months, ever felt so sad or hopeless almost every day for two weeks or more in a row that they stopped doing some usual activities 100 80 60 37.5 32.8 32.5 40 31.4 29.3 28.9 24.8 20 0 Total Males Females 9th 10th 11th 12th Q23 - Weighted Data
Detroit High School Survey Percentage of students who seriously considered attempting suicide during the past 12 months 100 80 60 40 17.7 15.6 16.2 12.7 14.6 14.0 20 11.0 0 Total Males Females 9th 10th 11th 12th Q24 - Weighted Data
Detroit High School Survey Percentage of students who made a plan about how they would attempt suicide during the past 12 months 100 80 60 40 12.2 13.1 20 11.3 10.9 11.4 10.5 9.5 0 Total Males Females 9th 10th 11th 12th Q25 - Weighted Data
Detroit High School Survey Percentage of students who actually attempted suicide one or more times during the past 12 months 100 80 60 40 15.6 14.1 20 12.0 10.0 9.5 9.2 8.9 0 Total Males Females 9th 10th 11th 12th Q26 - Weighted Data
Detroit High School Survey Percentage of students whose attempted suicide during the past 12 months resulted in an injury, poisoning, or overdose that had to be treated by a doctor or nurse 100 80 60 40 20 4.3 4.5 3.9 3.8 3.7 2.5 2.8 0 Total Males Females 9th 10th 11th 12th Q27 - Weighted Data
Detroit High School Survey Percentage of students who ever tried cigarette smoking, even one or two puffs 100 80 60.4 62.3 60.3 60.8 60.6 60.7 57.4 60 40 20 0 Total Males Females 9th 10th 11th 12th Q28 - Weighted Data
Detroit High School Survey Percentage of students who smoked a whole cigarette for the first time before age 13 100 80 60 40 22.1 15.8 15.9 15.8 13.7 20 10.1 10.2 0 Total Males Females 9th 10th 11th 12th Q29 - Weighted Data
Detroit High School Survey Percentage of students who smoked cigarettes on one or more of the past 30 days 100 80 60 40 20 10.7 10.0 9.3 8.8 9.1 7.7 6.9 0 Total Males Females 9th 10th 11th 12th Q30 - Weighted Data
Detroit High School Survey Percentage of students who smoked cigarettes on 20 or more of the past 30 days 100 80 60 40 20 3.1 2.7 1.6 1.6 1.3 1.7 0.8 0 Total Males Females 9th 10th 11th 12th M1 - Weighted Data
Detroit High School Survey Percentage of students who smoked two or more cigarettes per day on the days they smoked during the past 30 days 100 80 60 40 20 5.1 4.3 4.4 3.9 3.7 4.0 2.5 0 Total Males Females 9th 10th 11th 12th Q31 - Weighted Data
Detroit High School Survey Percentage of students who smoked more than 10 cigarettes per day on the days that they smoked during the past 30 days 100 80 60 40 20 0.9 0.8 0.6 0.5 0.7 0.3 0.0 0 Total Males Females 9th 10th 11th 12th M2 - Weighted Data
Detroit High School Survey Percentage of students who usually got their own cigarettes by buying them in a store or gas station during the past 30 days 100 80 60 40 20 5.4 3.9 2.8 2.7 3.0 2.2 2.2 0 Total Males Females 9th 10th 11th 12th Q32 - Weighted Data
Detroit High School Survey Percentage of students less than 18 years of age who were current smokers and purchased cigarettes at a store or gas station during the past 30 days 100 80 60 27.8 40 20 0 Total Males Females 9th 10th 11th 12th M3 - Weighted Data Missing bars indicate less than 100 respondents in the subgroup.
Detroit High School Survey Percentage of students who smoked cigarettes on school property on one or more of the past 30 days 100 80 60 40 20 4.2 3.6 3.9 3.0 3.3 2.8 1.8 0 Total Males Females 9th 10th 11th 12th Q33 - Weighted Data
Detroit High School Survey Percentage of students who ever smoked cigarettes daily, that is, at least one cigarette every day for 30 days 100 80 60 40 20 6.6 6.0 5.7 5.5 4.8 5.3 4.2 0 Total Males Females 9th 10th 11th 12th Q34 - Weighted Data
Detroit High School Survey Among current smokers, the percentage who tried to quit smoking during the past 12 months 100 80 57.3 60 40 20 0 Total Males Females 9th 10th 11th 12th Q35 - Weighted Data Missing bars indicate less than 100 respondents in the subgroup.
Detroit High School Survey Percentage of students who used chewing tobacco, snuff, or dip on one or more of the past 30 days 100 80 60 40 20 3.5 3.7 3.4 3.2 2.7 2.4 1.8 0 Total Males Females 9th 10th 11th 12th Q36 - Weighted Data
Detroit High School Survey Percentage of students who used chewing tobacco, snuff, or dip on school property on one or more of the past 30 days 100 80 60 40 20 2.2 1.6 1.7 1.5 1.6 0.6 0.6 0 Total Males Females 9th 10th 11th 12th Q37 - Weighted Data
Detroit High School Survey Percentage of students who smoked cigars, cigarillos, or little cigars on one or more of the past 30 days 100 80 60 40 20 7.7 7.4 7.5 7.5 5.9 6.9 7.2 0 Total Males Females 9th 10th 11th 12th Q38 - Weighted Data
Detroit High School Survey Percentage of students who used any tobacco during the past 30 days 100 80 60 40 13.5 12.8 20 12.2 11.5 11.8 9.5 10.0 0 Total Males Females 9th 10th 11th 12th M4 - Weighted Data
Detroit High School Survey Percentage of students who had at least one drink of alcohol on one or more days during their life 100 76.3 76.4 73.5 72.5 80 70.1 64.9 63.3 60 40 20 0 Total Males Females 9th 10th 11th 12th Q39 - Weighted Data
Detroit High School Survey Percentage of students who had their first drink of alcohol other than a few sips before age 13 100 80 60 40.7 35.0 40 31.3 27.9 27.7 25.2 18.8 20 0 Total Males Females 9th 10th 11th 12th Q40 - Weighted Data
Detroit High School Survey Percentage of students who had at least one drink of alcohol on one or more of the past 30 days 100 80 60 38.4 34.6 34.4 40 29.2 30.9 27.7 27.1 20 0 Total Males Females 9th 10th 11th 12th Q41 - Weighted Data
Detroit High School Survey Percentage of students who had five or more drinks of alcohol in a row, that is, within a couple of hours, on one or more of the past 30 days 100 80 60 40 12.6 20 11.5 9.6 10.5 10.0 9.4 7.9 0 Total Males Females 9th 10th 11th 12th Q42 - Weighted Data
Detroit High School Survey Percentage of students who had at least one drink of alcohol on school property on one or more of the past 30 days 100 80 60 40 20 7.4 6.8 6.1 6.4 5.5 6.2 6.3 0 Total Males Females 9th 10th 11th 12th Q43 - Weighted Data
Detroit High School Survey Percentage of students who used marijuana one or more times during their life 100 80 49.6 60 48.2 43.7 45.0 43.3 41.8 39.2 40 20 0 Total Males Females 9th 10th 11th 12th Q44 - Weighted Data
Detroit High School Survey Percentage of students who tried marijuana for the first time before age 13 100 80 60 40 18.1 15.4 13.4 20 11.5 11.1 9.7 8.6 0 Total Males Females 9th 10th 11th 12th Q45 - Weighted Data
Detroit High School Survey Percentage of students who used marijuana one or more times during the past 30 days 100 80 60 40 25.9 24.7 22.5 22.7 21.3 22.6 20.3 20 0 Total Males Females 9th 10th 11th 12th Q46 - Weighted Data
Detroit High School Survey Percentage of students who used marijuana on school property one or more times during the past 30 days 100 80 60 40 20 9.4 8.4 9.2 7.2 8.2 7.4 6.3 0 Total Males Females 9th 10th 11th 12th Q47 - Weighted Data
Detroit High School Survey Percentage of students who used any form of cocaine, including powder, crack, or freebase one or more times during their life 100 80 60 40 20 3.0 3.0 3.0 2.3 1.7 1.4 1.1 0 Total Males Females 9th 10th 11th 12th Q48 - Weighted Data
Detroit High School Survey Percentage of students who used any form of cocaine, including powder, crack, or freebase one or more times during the past 30 days 100 80 60 40 20 2.4 1.6 1.8 1.5 1.6 0.9 0.7 0 Total Males Females 9th 10th 11th 12th Q49 - Weighted Data
Detroit High School Survey Percentage of students who sniffed glue, breathed the contents of aerosol spray cans, or inhaled any paints or sprays to get high one or more times during their life 100 80 60 40 20 10.7 12.2 10.8 9.9 9.0 5.9 6.1 0 Total Males Females 9th 10th 11th 12th Q50 - Weighted Data
Detroit High School Survey Percentage of students who sniffed glue, breathed the contents of aerosol spray cans, or inhaled any paints or sprays to get high one or more times during the past 30 days 100 80 60 40 20 5.5 5.4 4.2 4.3 2.5 3.0 2.4 0 Total Males Females 9th 10th 11th 12th Q51 - Weighted Data
Detroit High School Survey Percentage of students who used heroin one or more times during their life 100 80 60 40 20 3.4 2.7 2.5 2.2 2.3 1.9 1.2 0 Total Males Females 9th 10th 11th 12th Q52 - Weighted Data
Detroit High School Survey Percentage of students who used methamphetamines one or more times during their life 100 80 60 40 20 3.5 3.7 3.0 2.4 2.6 1.7 1.5 0 Total Males Females 9th 10th 11th 12th Q53 - Weighted Data


