Download
1 / 15
180 likes | 431 Vues
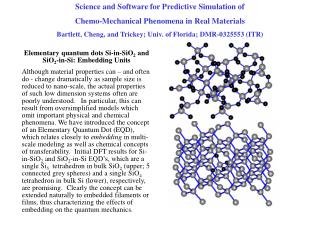
Evolution of Si-SiO 2 interface trap density under electrical stress in MOSFETs with ultrathin oxides. F. Rahmoune and D. Bauza Institut de Microélectronique, Electromagnétisme et Photonique (IMEP), UMR CNRS 5130, INPG, ENSERG, 23 rue des Martyrs, BP 257, 38016 Grenoble Cedex 1, France.

E N D
Evolution of Si-SiO2 interface trap density under electrical stress in MOSFETs with ultrathin oxides F. Rahmoune and D. Bauza Institut de Microélectronique, Electromagnétisme et Photonique (IMEP), UMR CNRS 5130, INPG, ENSERG, 23 rue des Martyrs, BP 257, 38016 Grenoble Cedex 1, France. ULIS 2003-Udine Italy
OUTLINE 1. Introduction 2. Extraction of Dit 2.1 Ghetti et al model 2.2 Bauza’s method 3. Results 3.1 Evolution of Dit with electrical stress 3.2 Discussion 4. Conclusion ULIS 2003-Udine Italy
1. Introduction Dit extraction (ultra thin oxide) - Infeasible up to recently due to QM effects, - Crucial for evaluating the technological process, as before, and for studying oxide degradation (at low voltages the tunneling current is trap assisted) Bauza’s method (EDL 2002) Small gate pulse Decisive features allowing Dit extraction 1. Tunneling current is strongly reduced. 2. QM effects in the accumulation and inversion layers can be overlooked. 3. Carrier emission does not contribute to the CP current. Ghetti et al. Model (ED 2000) SILC approach 1. Relies on the tunneling current with Dit 2. Better understanding of SILC in MOS devices with ultra thin oxides. 3. But numerous parameters (Dit(E), , Dit(xox), mox, Eb ) and several possible mechanisms. ULIS 2003-Udine Italy
2. Extraction of Dit 2.1 Ghetti et al Model (1/2) (IEEE TED Vol. 47 N°12, 2000) At high enough doping levels ( 8 1018 cm-3) and at Vg < 0, the main mechanism responsible for the low voltage tunneling current is the tunneling of gate electrons into the anode interface states (TEDit). TEDit is given by the numerical model : The possible components of low negative voltage tunneling current. ULIS 2003-Udine Italy
2. Extraction of Dit 2.1 Ghetti et al Model (2/2) (IEEE TED Vol. 47 N°12, 2000) JTEDit is very sensitive to : 1. The interface state distribution 2. The electrical stress Therefore, this technique can be exploited to estimate Dit(E) in ultra thin oxides, as long as Ig is detectable in the voltage range -|Vfb|< Vg <0. ULIS 2003-Udine Italy
2. Extraction of Dit -Principle of Charge pumping CP set up Elliot curves ULIS 2003-Udine Italy
2. Extraction of Dit 2.2 Bauza’s method (1/3) (IEEE EDL Vol. 23 N°11, 2002) This method is based on small gate pulses. If emission does not contribute to the CP current and if all the traps, from fast to slow traps, between the Fermi level position Ehand El at the interface, are filled Eq. 1 Procedure 1. Extract Elliot curves for a given Vsw at different frequencies. 2. Repeat procedure 1 for different values of Vsw. 3. In the region of reliable extraction, Dit (Eq. 1) should be independent of frequency and gate pulse amplitude. ULIS 2003-Udine Italy
2. Extraction of Dit 2.2 Bauza’s method (2/3) (IEEE EDL Vol. 23 N°11, 2002) To obtain Elliot curves, the tunneling current must be suppressed : 1. Measure Icp (Vl) 2. Suppress the tunneling current by measuring the same Elliot curves using the lowest possible frequency (P. Masson ’s method ) (EDL Vol.20 N°2,1999) Icp(Vl) Elliot curve ULIS 2003-Udine Italy
2. Extraction of Dit 2.2 Bauza’s method (3/3) (IEEE EDL Vol. 23 N°11, 2002) In the region of reliable extraction, Dit (Eq. 1) should be independent of frequency and pulse amplitude. Dit = 2 1010 eV-1cm-2 ULIS 2003-Udine Italy
3. Results 3.1 Evolution of Dit with electrical stress (1/4 ) In the SILC approach The relative variation of the gate current density with stress, J/J0, are equal to the relative variations of the interface trap density J/J0 =Dit/Dit0 ULIS 2003-Udine Italy
3. Results 3.1 Evolution of Dit with electrical stress (2/4 ) Dit0 of SILC = value measured by CP ULIS 2003-Udine Italy
3. Results 3.1 Evolution of Dit with electrical stress (3/4 ) Case of other oxide thickness Dit/Dit0 SILC >> Dit/Dit0 CP ULIS 2003-Udine Italy
3. Results 3.1 Evolution of Dit with electrical stress (4/4 ) Sensing Vg < 0 Sensing Vg > 0 At Vg > 0, electrons tunnel from the interface states towards the gate. The lower part of the Si bandgap is probed. Dit/Dit0 SILC > Dit/Dit0 CP ULIS 2003-Udine Italy
3. Results 3.2 Discussion 1. Results, i.e. SILC with regard to CP, are similar whatever dox is. 2. SILC 2.1 The Dit variations depend on the sensing bias used. 2.2 This corresponds to Dit (or ) increasing faster with stress from the valence band edge towards the conduction band edge (EC). “A”---------> EC “C”---------> Ei “C’ ”-------> EV 2.3 Dit always greater for SILC than for CP. 2.4 variations can not explain the results also. 3. CP - Averages Dit in the energy region scanned (0.35 to 0.42 eVfrom Ei depending on the devices). SILC and CP results can not be reconciled. ULIS 2003-Udine Italy
4. Conclusion 1. The evolution of Dit under electrical stress has been studied using a recent CP based technique. 2. The results have been compared with those obtained from SILC measurements. 3. The variations of Dit under electrical stress are found larger in the SILC approach than when measured by CP, regardless of the oxide thickness. 4. Ghetti’s model (Tunneling from the gate towards Si-SiO2 interface states) holds for high doping levels. 5. Our results are similar regardless of the doping level and always give much lower Dit values than SILC. It seems that there is not a simple explanation for SILC results, i.e. large variations and mechanism. Interest of CP for Dit extraction and SILC study in state-of-the art MOS devices. ULIS 2003-Udine Italy

![Thickness map [nm] of the poly-Si layer of a poly-Si/SiO 2 /Si multi-layer structure](https://cdn1.slideserve.com/2972061/slide1-dt.jpg)