Download
1 / 23
230 likes | 315 Vues
This project combined remote sensing imagery with survey data to estimate acreage and produce a crop-specific land cover data layer for distribution in GIS format. The study focused on the Chesapeake Bay Watershed in 2002, utilizing Landsat imagery to map agricultural coverage in the region. The data was collected through field enumeration and digitizing processes, resulting in a statewide mosaic of crop-specific products. The accuracy of the 2002 New York Cropland Data Layer was assessed by major cover types. The project was sponsored by Towson University and aimed to provide accurate crop year 2002 data without revealing farmer-reported information.

E N D
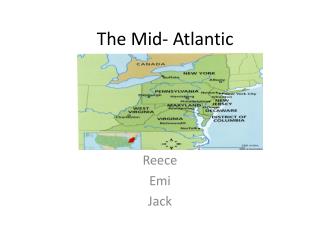
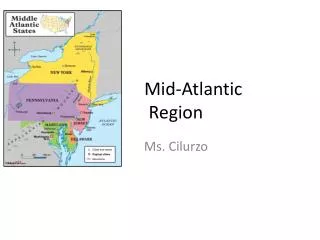
Ten State Mid-Atlantic Cropland Data Layer Project Remote Sensing Across the Great Lakes Rochester, NY 4/6/2006 Rick Mueller Program Manager USDA/National Agricultural Statistics Service
Cropland Data Layer Purpose • Combine remote sensing imagery and NASS survey data to produce supplemental acreage estimates for the state's major commodities • Production of a crop-specific land cover data layer for distribution in industry standard "GIS" format
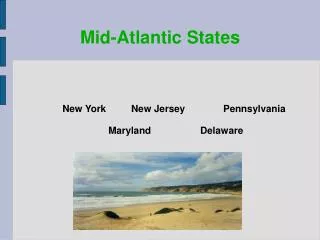
10 State - Chesapeake Bay Watershed • Towson University (CGIS)– project sponsor • Based on crop year 2002 • Agricultural Census: Agricultural Coverage Evaluation Survey (ACES) • June Agricultural Survey (JAS) • Utilized both Landsat TM & ETM • Map the agricultural extent and variety
Cropland Data Layer Background • June Agricultural Survey (JAS) – National in Scope • 41,000 farms visited • 11,000 one-square mile sample area segments visited • Most states contain between 150 – 400 segments • Planted acreage estimate • Dependant upon the ground survey data • Unbiased statistical estimator of crop area • State and county level estimates
Project Scope • 43 footprints • 80 scenes • 36 TM • 44 ETM
Area Sampling Frame • Stratify based on percent cultivated land • Subdivide strata into primary sampling units (PSU) • Selected PSU's divided into secondary sampling units or segments
2002SegmentSampleSize June Agricultural Survey Agricultural Coverage Evaluation Survey
1 sq. mi. JAS segment annotated by enumerator on a 1:8,000-scale NAPP photo Enumerator records field extents, cover types and acreage
2002 JAS Questionnaire • Enumerators account for all land usage in segment • Draw off field location by direct observation • Directly link questionnaire to segment photo
Field Enumeration Digitizing & Labeling Classification Segment Processing
Image Processing by Analysis District • Modified ISODATA clustering by cover type • Maximum likelihood classification • Stitch scenes to produce a statewide mosaic • Release crop specific product in public domain
Accuracy Assessment of the 2002 New York Cropland Data Layer by Crop
Accuracy Assessment of Analysis District 07 by Major Cover Type
Program Summary Area Sampling Frame Segment Boundaries JAS Questionnaire Raw Satellite Image Categorized Images Mosaicked CDL Estimates
Project sponsor: Towson U. Produced for crop year 2002 Categorization & accuracy assessment GeoTiff images .html In no case is farmer reported data revealed or derivable from the public use Cropland Data Layer Mid-Atlantic CDL Project Conclusion