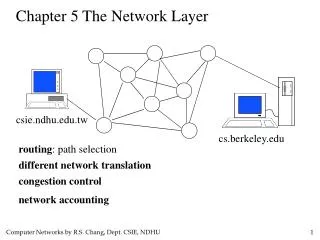
DEM’s, Watershed and Stream Network Delineation
650 likes | 1.24k Vues
DEM’s, Watershed and Stream Network Delineation. DEM Data Sources Study Area in West Austin with a USGS 30m DEM from a 1:24,000 scale map Eight direction pour point model (flow direction and flow accumulation grids) Stream network definition Watershed delineation. DEM Data Sources.

DEM’s, Watershed and Stream Network Delineation
E N D
Presentation Transcript
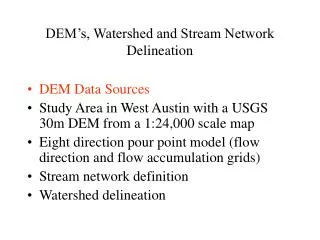
DEM’s, Watershed and Stream Network Delineation • DEM Data Sources • Study Area in West Austin with a USGS 30m DEM from a 1:24,000 scale map • Eight direction pour point model (flow direction and flow accumulation grids) • Stream network definition • Watershed delineation
DEM Data Sources • Shuttle Radar Topography Mission (SRTM) • 30m DEMs from 1:24,000 scale map • 1” National Elevation Dataset • 3" (100m) DEMs from 1:250,000 scale maps • 30" DEM of the earth (GTOPO30)
Santa Barbara, California http://srtm.usgs.gov/srtmimagegallery/index.html
San Andreas Fault, California http://srtm.usgs.gov/srtmimagegallery/index.html
Salt Lake City, Utah http://srtm.usgs.gov/srtmimagegallery/index.html
Mt Kilimanjaro, Tanzania http://srtm.usgs.gov/srtmimagegallery/index.html
Shuttle Radar Topography Mission (SRTM) • 1 arc-second elevation data for the United States, 3 arc-second data for the globe • Produced by radar measurements from a Shuttle mission, Feb 11-22, 2000 • http://srtm.usgs.gov/data/obtainingdata.html
Interferometry used by SRTM In interferometry, two images are taken from different vantage points of the same area. The slight difference in the two images allows scientists to determine the height of the surface.
30m DEMs • Best resolution standardized data source available for the US • Coverage of the country is incomplete • Data by 7.5’ map sheets in UTM projection • Link for UShttp://edcwww.cr.usgs.gov/Webglis/glisbin/guide.pl/glis/hyper/guide/usgs_dem • Link for Texas http://www.tnris.state.tx.us/DigitalData/DEMs/dems.htm
Seamless 1” DEM for the US in 1° x 1° blocks Compiled by synthesizing the 30m DEM’s from 1:24,000 scale maps Link to website http://edcnts12.cr.usgs.gov/ned/ National Elevation Dataset
http://seamless.usgs.gov/ Seamless Data Distribution http://edcnts14.cr.usgs.gov/Website/store/viewer.htm
Coverage of 30m, 1” and 3" DEMs 1” and 3” DEMs 1º 30m DEM 7.5´ 7.5´ 1º
3” DEMs • Derived by US Defence Mapping Agency, available from USGS for the whole US • Data in geographic coordinates by 1;250,000 map sheet names (1ºx 1º) cells in (1ºx 2º) maps • Needs to be projected to planar coordinates • Linkhttp://edcwww.cr.usgs.gov/doc/edchome/ndcdb/ndcdb.html
Cell Size 30m 100m
30" DEM GTOPO30 • Produced by USGS from 3" grids and Digital Chart of the World topography • Coverage complete for the earth • Projected cell size is 1km • Data must be projected before use • Linkhttp://edcwww.cr.usgs.gov/landdaac/gtopo30/gtopo30.html
GTOPO30 Source: http://edcwww.cr.usgs.gov/landdaac/gtopo30/gtopo30.html
Drainage in North America Source: http://edcwww.cr.usgs.gov/landdaac/gtopo30/hydro/namerica.html
Drainage Basins of North America Source: http://edcwww.cr.usgs.gov/landdaac/gtopo30/hydro/na_basins.html
DEM’s, Watershed and Stream Network Delineation • DEM Data Sources • Study Area in West Austin with a USGS 30m DEM from a 1:24,000 scale map • Eight direction pour point model (flow direction and flow accumulation grids) • Stream network definition • Watershed delineation
Study Region in West Austin Hog Pen Ck 4 km 4 km
Topographic MapAustin West, 1:24,000 Scalehttp://www.tnrcc.state.tx.us/gis/raster.html 20 ft contour 100 ft contour Stream Center Line
Watershed Delineation by Hand Digitizing Watershed divide Outlet Drainage direction
200 Meter Mesh (Universal Transverse Mercator Coordinates) 1km 1km
100m 100 Meter Mesh (UTM Coordinates) 1km 100m 1km
Austin West 30 Meter DEMElevations in meters ftp://ftp.tnris.state.tx.us/tnris/demA.html
DEM Elevations 720 720 Contours 740 720 700 680 740 720 700 680
DEM Elevations Contours 700 680
DEM’s, Watershed and Stream Network Delineation • DEM Data Sources • Study Area in West Austin with a USGS 30m DEM from a 1:24,000 scale map • Eight direction pour point model (flow direction and flow accumulation grids) • Stream network definition • Watershed delineation
67 56 49 46 50 53 44 37 38 48 58 55 22 31 24 61 47 21 16 19 53 34 12 11 12 Digital Elevation Model
67 56 49 46 50 53 44 37 38 48 58 55 22 31 24 61 47 21 16 19 53 34 12 11 12 Cell Definition cell size 50 (cell value) cell
32 64 128 16 1 8 4 2 Eight Direction Pour Point Model
67 56 49 53 44 37 58 55 22 Direction of Steepest Descent 1 1 67 56 49 53 44 37 58 55 22 Slope:
2 2 4 4 8 1 2 4 8 4 128 1 2 4 8 2 1 4 4 4 1 1 1 2 16 Flow Direction Grid
Austin West 30 Meter DEMElevations in meters ftp://ftp.tnris.state.tx.us/tnris/demA.html
32 64 128 16 1 8 4 2 Flow Direction Grid
DEM’s, Watershed and Stream Network Delineation • DEM Data Sources • Study Area in West Austin with a USGS 30m DEM from a 1:24,000 scale map • Eight direction pour point model (flow direction and flow accumulation grids) • Stream network definition • Watershed delineation
Flow Accumulation Grid 0 0 0 0 0 0 0 0 0 0 0 3 2 2 0 3 2 0 0 2 0 0 1 0 0 11 0 1 0 11 0 0 0 1 15 0 0 1 0 15 1 0 2 5 24 2 5 0 1 24 Link to Grid calculator
0 0 0 0 0 0 3 2 2 0 0 1 0 0 11 0 0 0 1 15 1 0 2 5 24 Flow Accumulation > 5 Cell Threshold
Stream Network for 5 cell Threshold Drainage Area 0 0 0 0 0 3 2 0 0 2 0 0 1 0 11 0 0 1 0 15 2 5 0 1 24
Streams with 200 cell Threshold(>18 hectares or 13.5 acres drainage area)
“Burning In” the Streams Take a mapped stream network and a DEM Make a grid of the streams Raise the off-stream DEM cells by an arbitrary elevation increment Produces "burned in" DEM streams = mapped streams = +