Linear Programming
Linear Programming. Pioneers of LP. George Dantzig 1947 NarendraKarmarkar. Linear Programming Graphical analysis Computational analysis (Simplex Method). Computer Solution of the LP Problem. Simplex Method


Linear Programming
E N D
Presentation Transcript
Pioneers of LP George Dantzig 1947 NarendraKarmarkar
Linear Programming • Graphical analysis • Computational analysis (Simplex Method)
Computer Solution of the LP Problem Simplex Method A step-by-step mathematical procedure for finding the optimal solution to a LP problem. This procedure moves from corner point to corner point of the feasible solution space. Most practical applications of LP use computer programs to perform the calculations and to obtain the optimal solution.
Most business resource-allocation problems deal with constraints (capital, labor, legal, environmental). A wide variety of production, finance, marketing, and distribution problems employ the linear programming framework.
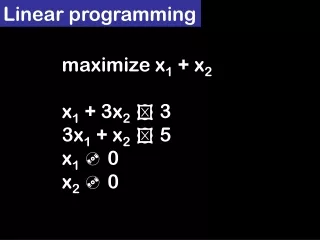
What is Linear Programming (LP)? • LP is a tool to solve maximization/minimization problems subject to underlying constraints. • Assumptions: The objective function and the inequality constraint functions are linear functions of the decision variables. • Applications: production decisions, profit maximization, investment decisions, scheduling, cost minimization, etc. Question: What is the difference between optimization problems solved by calculus-based methods and LP?
Example: Consider the White Company, a manufacturer of gas (Product 1) and electric (Product 2) clothes dryers. Problem: to determine the optimal levels of products to manufacture. Production consists of a machine process that takes raw materials and converts them into unassembled parts. These parts are sent to one of two divisions for assembly. Division 1 for Product 1 Division 2 for Product 2
Product 1 requires 20 units of raw material and 5 hours of machine-processing time. Product 2 requires 40 units of raw material and 2 hours of machine-processing time. 400 units of raw material are available. 40 hours of machine processing time are available. The capacities of the two assembly divisions are 6 and 9 units.
The percent contribution to profit and overhead (fixed costs) is $100 for each unit of Product 1 and $60 for each unit of Product 2. Formulation of the LP Problem #1 Formulate the Objective Function: Let P1 denote Product 1 and let P2 denote Product 2. P1 is the number of gas clothes dryers to manufacture and P2 is the number of electric clothes dryers to manufacture. The objective of White Company is to maximize profits. Max Profits (π) = 100P1 + 60P2
#2 Consider Constraints (1) Raw material constraint 20P1 + 40P2 ≤ 400 (2) Machine processing time constraint 5P1 + 2P2≤ 40 (3) Capacity constraint of Division 1 P1≤ 6 (4) Capacity constraint of Division 2 P2≤ 9 (5) Non-negativity constraints P1 ≥ 0 and P2 ≥ 0
Various techniques are available for solving linear programming problems. -- Graphical analysis Graphing the Feasible Solution Space Combining all the constraints yields the feasible solution space, which simultaneously satisfies all the constraints of the problem.
Graphing the Objective Function The profit function can be represented graphically as a series of parallel isoprofit lines. Each combination of output levels (P1 and P2) lying on a given line has the same total profit. The objective of profit maximization can be interpreted graphically to find an output combination that falls on as high an isoprofit line as possible. The resource constraints obviously limit us from increasing output and profits indefinitely.
Graphical Solution Combining the graphs of the feasible solution space and the objective function yields the output combination point within the feasible solution space that lies on the highest possible isoprofit line.
Optimal Solution a feasible solution that maximizes or minimizes the value of the objective function. Sometimes it is difficult to read the exact coordinates of the optimal solution from the graph. At point C, the machine-processing time constraint and the raw material constraint intersect. Therefore, 20P1 + 40P2 = 400 5P1 + 2P2 = 40 so, P1 = 5 and P2 = 7.5
Extreme Points and the Optimal Solution Extreme point graphically a corner point of the feasible solution space. Two important general properties of an optimal solution to a LP problem. (1) The optimal solution lies on the boundary of the feasible space. => we can ignore interior points on the feasible solution space when searching for an optimal solution. (2) The optimal solution occurs at one of the extreme points (corner points) of the feasible solution space.
Multiple Optimal Solutions Suppose that the objective function in our problem were to maximize π = 100P1 + 40P2.
In addition to the optimal combination of outputs P1 and P2 to produce (P1 = 5 and P2 = 7.5) and the maximum π ($950), we also are interested in the amount of each resource to use in the production process. Raw Material Constraint 20P1 + 40P2 = 20(5) + 40(7.5) = 400 all available raw materials (400 units) are used in producing the optimal output combination. Machine-Processing Time Constraint 5P1 + 2P2 = 5(5) + 2(7.5) = 40 all available machine-producing time is used in producing the optimal output combination. Division 1 CapacityDivision 2 Capacity P1 ≤ 6 but P1 = 5 P2 ≤ 9 but P2 = 7.5 So, 1 unit of Division 1 assembly capacity and 1.5 units of Division 2 assembly capacity are unused in producing the optimal output combination.
Slack Variables Unused or idle resources associated with a less than or equal to constraint are referred to as slack. Slack variables can be added to the formation of a LP problem to represent this slack or idle capacity. Max π = 100P1 + 60P2 + 0S1 + 0S2 + 0S3 + 0S4 20P1 + 40P2 + S1 = 400 5P1 + 2P2 + S2 = 40 P1 + S3 = 6 P2 + S4 = 9 P1, P2, S1, S2, S3, S4 ≥ 0.
Primal Problem The original formulation of the LP problem. Dual Problem Associated with every LP problem is a related dual LP problem. If the objective in the primal problem is maximization of some function, then the objective in the dual problem is the minimization of a related (but different) function. Conversely, a primal minimization problem has a related dual maximization problem. The dual variables represent the variables contained in the dual problem.
Dual Problem of the White Company Profit Maximization Problem. Associated with each constraint of the primal problem is a dual variable. Because the primal problem had four constraints, the dual problem has four variables, say W1,, W2, W3, and W4. (Note: the constraints requiring each of the primal variables to be greater than or equal to zero P1 ≥ 0, P2 ≥ 0, are not included when determining the number of dual variables). The objective of the dual problem is minimization, that is to minimize the total cost or value of the resources employed in the process. Specify, minimize Z = 400W1 + 40W2 + 6W3 + 9W4. The constants 400, 40, 6, and 9 come from the resource constraints in the primal problem; W1, W2, W3, and W4 are expressed in $/unit.
The constraints of the dual problem come from the fact that 20 units of W1,, 5 units of W2, and 1 unit of W3 are involved to produce P1 and that 40 units of W1, 2 units of W2, and 1 unit of W4 are involved to produce P2. 20W1 + 5W2 + W3 ≥ 100 40W1 + 2W2 + W4 ≥ 60 W1 ≥ 0, W2 ≥ 0, W3 ≥ 0, and W4 ≥ 0. The value of the resources used in producing one unit each of P1 and P2 must be at least as great as the profit received from the sale of one unit of each product.
Economic Interpretation of the Dual Variables The dual variables measure the “imputed values” or shadow prices of each of the scarce resources. The shadow price measures the contribution to the objective function of one additional unit of a resource. W1 ,= $.625 per unit, W2 = $17.50 per unit, W3 = W4 = $0 per unit. Each dual variable indicates the change in profits for an incremental change in the amount of each of the various resources. In this way, the dual variables are similar to the Lagrangian Multiplier λ.
W2 = $17.50 indicates that profits could be increased by as much as $17.50 if an additional hour of machine capacity could be made available to the production process. W1 = $.625 indicates that profits could be increased by as much as $.625 if additional units of raw material could be made available to the production process. W3 = W4 = $0 indicates profits would not increase at all if additional assembly capacity were available.
Example Cost Minimization: Silverado Mining Company Suppose that the Silverado Mining Company owns two different mines (A and B) for producing uranium ore. After the ore is mined, it is separated into three grades – high, medium and low. Mine A produces .75 tons of high grade ore/hr. Mine A produces .25 tons of medium grade ore/hr. Mine A produces .50 tons of low grade ore/hr. Mine B produces .25 tons of high grade ore/hr. Mine B produces .25 tons of medium grade ore/hr. Mine B produces 1.50 tons of low grade ore/hr. The Company has contracts with uranium processing plants to supply a minimum of 36 tons of high-grade ore, 24 tons of medium-grade ore, and 72 tons of low-grade ore per week.
It costs the company $50/hr to operate Mine A and $40/hr to operate Mine B Objective: The company wishes to determine the number of hours per week it should operate each mine to minimize the total cost of fulfilling its supply contracts. Formulation of the LP Problem Objective Function: Define H1 as the number of hours per week that Mine A is operated and H2 as the number of hours per week that Mine B is operated. Minimize TC = 50H1 + 40H2 TC (refers to total cost).
Constraint Relationships High-Grade Ore Contract .75H1 + .25H2 ≥ 36. Medium-Grade Ore Contract .25H1 + .25H2 ≥ 24. Low-Grade Ore Contract .50H1 + 1.50H2 ≥ 72. Non-negativity Constraints H1≥ 0, H2 ≥ 0.
Surplus Variables In a minimization problem, surplus variables are subtracted from the greater than or equal to inequality constraints to convert these constraints to equalities. Minimize TC = 50H1 + 40H2 + 0S1 + 0S2 + 0S3. s.t. .75H1 + .25H2 – S1 = 36 .25H1 + .25H2 – S2 = 24 .50H1 + 1.50H2 – S3 = 72 H1, H2, S1, S2, S3 ≥ 0.
Graph the Feasible Solution Space based on .75H1 + .25H2≥ 36 .25H1 + .25H2 ≥ 24 .50H1 + 1.50H2≥ 72 Iso-Cost line TC = 50H1 + 40H2 H1 8 4 400 200 5 10 H2
H1 144 120 96 72 48 24 ABCD Represents the Feasible Solution Boundary A(0,144) .50H1 + 1.50H2 = 72 B(24,72) isocost line at TC = $4,080, TC = 50H1, + 40H2 .25H1 + .25H2 = 24 C(72,24) .75H1 + .25H2 = 36 D(144,0) 24 48 72 96 120 144 H2
TC At point A, H1 = 144 H2 = 0 $50(144) + $40(0) = $7,200 B, H1 = 72 H2 = 24 $50(72) + $40(24) = $4,560 C, H1 = 24 H2= 72 $50(24) + $40(72) = $4,080 D, H1 = 0 H2 = 144 $50(0) + $40(144) = $5,760 At point B, intersection of .50H1 + 1.50H2 = 72 .25H1 + .25H2 = 24 H1 = 72, H2 = 24 At point C, intersection of .25H1 + .25H2 = 24 .75H1 + .25H2 = 36 H1 = 24, H2 = 72 Minimum TC combination of H1 & H2 occurs at point C. Minimum TC is $4,080.