Linear Programming
Linear Programming. Operations Management Dr. Ron Tibben-Lembke. Motivating Example.


Linear Programming
E N D
Presentation Transcript
Linear Programming Operations Management Dr. Ron Tibben-Lembke
Motivating Example • Suppose you are an entrepreneur making plans to make a killing over the summer by traveling across the country selling products you design and manufacture yourself. To be more straightforward, you plan to follow the Dead all summer, selling t-shirts.
Example • You are really good with tie-dye, so you earn a profit of $25 for each t-shirt. • The sweatshirt screen-printed sweatshirt makes a profit of $20. • You have 4 days before you leave, and you want to figure out how many of each to make before you head out for the summer. • You plan to work 14 hours a day on this. It takes you 30 minutes per tie dye, and 15 minutes to make a sweatshirt.
Example You have a limited amount of space in the van. Being an engineer at heart, you figure: • If you cram everything in the van, you have 40 cubit feet of space in the van. • A tightly packed t-shirt takes 0.2 ft3 • A tightly packed sweatshirt takes 0.5 ft3. How many of each should you make?
Summary 14 hrs / day Van: 40.0 ft3 4 days Tshirt: 0.2 ft3 30 min / tshirt Sshirt: 0.5 ft3 15 min / Sshirt How many should we make of each?
Linear Programming • What we have just done is called “Linear Programming.” • Has nothing to do with computer programming • Invented in WWII to optimize military “programs.” • “Linear” because no x3, cosines, x*y, etc.
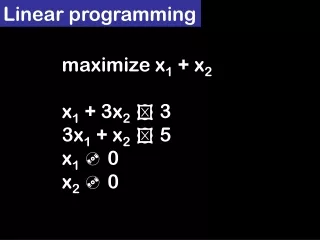
Standard Form • Linear programs are written the following way: Max 3x + 4y s.t. x + y <= 10 x + 2y <= 12 x >= 0 y >= 0
Standard Form Objective Coefficients • Linear programs are written the following way: Objective Function Max 3x + 4y s.t. x + y <= 10 x + 2y <= 12 x >= 0 y >= 0 Constraints RHS (right hand side) Non-negativity Constraints LHS (left hand side) inequalities
Example 2 • mp3 - 4 hrs electronics work • - 2 hrs assembly time • DVD - 3 hrs assembly time • - 1 hrs assembly time • Hours available: 240 (elect) 100 (assy) • Profit / unit: mp3 $7, DVD $5 X1 = number of mp3 players to make X2 = number of DVD players to make
Standard Form Max 7x1 + 5x2 s.t. 4x1 + 3x2 <= 240 2x1 + 1x2 <= 100 x1 >= 0 x2 >= 0 electronics assembly
100 80 60 40 20 0 0 20 40 60 80 Graphical Solution X2 mp3 X1 DVD players
100 80 60 40 20 0 0 20 40 60 80 Graphical Solution X1 = 0, X2 = 80 X2 mp3 X1 = 60, X2 = 0 Electronics Constraint X1 DVD players
100 80 60 40 20 0 0 20 40 60 80 Graphical Solution X1 = 0, X2 = 100 Assembly Constraint X2 mp3 X1 = 50, X2 = 0 X1 DVD players
100 80 60 40 20 0 0 20 40 60 80 Graphical Solution Assembly Constraint Feasible Region – Satisfies all constraints X2 mp3 Electronics Constraint X1 DVD players
100 80 60 40 20 0 0 20 40 60 80 Isoprofit Lnes Isoprofit Line: X2 mp3 $7X1 + $5X2 = $210 (0, 42) (30,0) X1 DVD players
100 80 60 40 20 0 0 20 40 60 80 Isoprofit Lines X2 $280 mp3 $210 X1 DVD players
100 80 60 40 20 0 0 20 40 60 80 Isoprofit Lines $350 X2 $280 mp3 $210 X1 DVD players
100 80 60 40 20 0 0 20 40 60 80 Isoprofit Lines (0, 82) $7X1 + $5X2 = $410 X2 mp3 (58.6, 0) X1 DVD players
Mathematical Solution • Obviously, graphical solution is slow • We can prove that an optimal solution always exists at the intersection of constraints. • Why not just go directly to the places where the constraints intersect?
100 80 60 40 20 0 0 20 40 60 80 Constraint Intersections X1 = 0 and 4X1 + 3X2 <= 240 So X2 = 80 (0, 80) X2 mp3 4X1 + 3X2 <= 240 (0, 0) X1 DVD players
100 80 60 40 20 0 0 20 40 60 80 Constraint Intersections (0, 80) X2 mp3 X2 = 0 and 2X1 + 1X2 <= 100 So X1 = 50 (0, 0) (50, 0) X1 DVD players
100 80 60 40 20 0 0 20 40 60 80 Constraint Intersections 4X1+ 3X2 <= 240 2X1 + 1X2 <= 100 – multiply by -2 4X1+ 3X2 <= 240 -4X1 -2X2 <= -200 add rows together (0, 80) 0X1+ 1X2 <= 40 X2 = 40 substitute into #2 X2 2X1+ 40 <= 100 So X1 = 30 mp3 (0, 0) (50, 0) X1 DVD players
100 80 60 40 20 0 0 20 40 60 80 Constraint Intersections Find profits of each point. (0, 80) $400 X2 mp3 (30,40) $410 (50, 0) $350 (0, 0) $0 X1 DVD players
Do we have to do this? • Obviously, this is not much fun: slow and tedious • Yes, you have to know how to do this to solve a two-variable problem. • We won’t solve every problem this way.
Constraint Intersections • Start at (0,0), or some other easy feasible point. • Find a profitable direction to go along an edge • Go until you hit a corner, find profits of point. • If new is better, repeat, otherwise, stop. 100 Good news: Excel can do this for us. 80 60 mp3 X2 40 20 0 0 20 40 60 80 X1 DVD players
Formulating in Excel • Write the LP out on paper, with all constraints and the objective function. • Decide on cells to represent variables. • Enter coefficients of each variable in each constraint in a block of cells. • Compute amount of each constraint being used by current solution.
Current solution Amount of each constraint used by current solution
Formulating in Excel 5. Place inequalities in sheet, so you remember <=, >= 6. Enter amount of each constraint 7. Enter objective coefficients 8. Calculate value of objective function 9. Make sure you have plenty of labels. 10. Widen columns for readability.
Objective Function value of current solution RHS of constraints, Inequality signs.
Solving in Excel All we have so far is a big ‘what if” tool. We need to tell the LP Solver that this is an LP that it can solve. • Choose ‘Solver’ from ‘Tools’ menu
Solving in Excel • Choose ‘Solver’ from ‘Tools’ menu • Tell Solver what is the objective function, and which are variables. • Tell Solver to minimize or maximize
Solving in Excel • Choose ‘Solver’ from ‘Tools’ menu • Tell Solver what is the objective function, and which are variables. • Tell Solver to minimize or maximize • Add constraints: • Click ‘Add’, enter LHS, RHS, choose inequality • Click ‘Add’ if you need to do more, or click ‘Ok’ if this is the last one. • Add rest of constraints
Assuming Linear • You have to tell Solver that the model is Linear. Click ‘options,’ and make sure the ‘Assume Linear Model’ box is checked.
Assuming Linear • You have to tell Solver that the model is Linear. Click ‘options,’ and make sure the ‘Assume Linear Model’ box is checked. On this box, checking “assume non-negative” means you don’t need to actually add the non-negativity constraints manually. • Solve the LP: Click ‘Solve.’ Look at Results.
Solution is Found When a solution has been found, this box comes up. You can choose between keeping the solution and going back to your original solution. Highlight the reports that you want to look at.
Solution • After clicking on the reports you want generated, they will be generated on new worksheets. • You will return to the workbook page you were at when you called up Solver. • It will show the optimal solution that was found.
Answer Report • Gives optimal and initial values of objective function • Gives optimal and initial values of variables • Tells amount of ‘slack’ between LHS and RHS of each constraint, tells whether constraint is binding.
Sensitivity Report Variables: • Final value of each variable • Reduced cost: how much objective changes if current solution is changed • Objective coefficient (from problem)
Sensitivity Report Variables: • Allowable increase: How much the objective coefficient can go up before the optimal solution changes. • Allowable decrease How much the objective coefficient can go down before optimal solution changes. • Up to 24.667, Down to 23.333
Sensitivity Report Constraints • Final Value (LHS) • Shadow price: how much objective would change if RHS increased by 1.0 • Allowable increase, decrease: how wide a range of values of RHS shadow price is good for.
Limits Report • Tells ranges of values over which the maximum and minimum objective values can be found. • Rarely useful