Lecture 2.1
Lecture 2.1. 2.1. How to present the data of your research project, - and how data are presented in different disciplines. 2.2. Important points when presenting a research project, - and how to critically read a research article. Presenting the data of a research project, writing strategies.

Lecture 2.1
E N D
Presentation Transcript
Lecture 2.1 2.1. How to present the data of your research project, - and how data are presented in different disciplines. 2.2. Important points when presenting a research project, - and how to critically read a research article. Presenting the data of a research project, writing strategies.
The different ways of presenting data of a research project commonly varies greatly from discipline to discipline. - Between disciplines: What are the different writing styles within the article on traditional knowledge and use of natural resources in Guatemala by Nesheim et al., and the article by Stige et al. concerning climate and agropastoral production in Africa, - And among disciplines: What are the different writing styles between the among articles and the article by Ortner, or Wilhite et al. 2001?
Form and structure. • Length of texts – different scientific traditions in natural and social sciences. • Note the different length of the articles in the compendium. • Seldom foot-notes in text of natural sciences.. • Take two minutes and think of differences advantages and disadvantages with long texts versus short texts!
Rigid structure versus non rigid structure. • i.e. do not follow the purpose, methods, results – discussion structure. • The structure by headlines in the article by Nesheim et al., compared to the article by Ortner. By Nesheim et al. • Introduction • Study area • Methodology • Data analysis • Results • Discussion • Conclusion By Ortner 1. Geerts, Culture and power 2. Death and orientalism 3. Thick resistance, the cultural construction of agency 4. Death happens 5. Conclusions: Ironies of theory
Still, in most written texts variants of the below points are included. • Introduction • Methodology • Results • Discussion • Conclusion
Introduction (and study area) • Introduce the subject of interest. • Purpose • Ex. Peres et al. article “Here we show that patterns of variation in population size structure are consistent with recruitment bottlenecks resulting from long-term harvest”. • The need for the study! • As an example, the need for the study is clearly stated in the article by Stige et al. : “We need detailed knowledge about how different crop and livestock types respond..”. • Background, situate the frame of the study within the larger context.
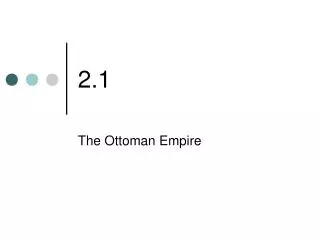
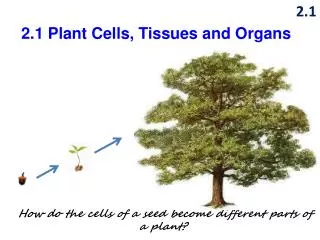
Introduction (and study area) • Hypothesis / Research questions. • The hypothesis or the research questions must be specifically focused. • Make sure that the questions are answered in the research article. • Place of research (study area). • includes information of the natural environment. • the history of the area. • various characteristics concerning the human population in the area. • A figure of the study area are often imbedded in the article.
Background • Include a more in-depth introduction of the subject to be discussed. • It could include historical facts, or other information of importance for the subject of focus. • Generally a different headline in the paper. • Ex.: In Nesheim et al. 2006; “The migrant community and the study area”, in Wilhite et al. 1996; “Contrasts in background variables”.
Methodology and (statistical analysis). • Methodology is important for the validity of the data and the comparability of the data. • Collect data in a systematic way using an explicit methodology, to show how we arrived at our conclusions. • Plot design and data collection must be accurately described. 10 m 100 m
Methodology and (statistical analysis). • Who and what will be studies? • How were the informants selected? • Which variables are measured and what are the units. • Statistical analysis/analysis of data, often as a separate under-section. • how are data coded and categorized • which analysis is being preformed and how it is being preformed. RPij = k0 + S0(longi, lati)
Results/Findings • The result section should include own results only, and no elements of discussion. • Tables and figures may visualize data in a nice way. • Tables and figures must be mentioned in the text. • Tables and figures must be clearly labeled. The road skid trails felling gaps The logging 4 plot.
Results/Findings Fig. 1 -”The density of seedlings and high, e.g. 180 – 230 seedlings – for then to decline rapidly in the subsequent dbh classes (fig. 1)”. -The climate effects we observe are strong, and particularly so for southern Africa, and particularly Regeneration classes of Calophyllum brasiliense Table 1. so for maize…(Table 1) (Stige et al. 2006).
Results • Don’t use inaccurate interpretation of your findings to make them agree with the conclusions you’re after. • Don’t report conclusions that are unsupported by your actual research • Don’t cover up results that you don’t like. • Report your findings accurately and rethink your original position.
Discussion • Each paragraph should have four parts, main message, critical assessment, comparison with other studies and conclusion. • The same relates to papers in which the findings and the discussion is written together. • Start with the main message answering the question posed in the introduction, and include the main supporting evidence. • Our results implythat African food production may be severely reduced if the global climate changes toward more El Niño-like conditions, as most climate models predict (IPC 2001). (Stige et al. 2006). • The clear message is that current Brazil nut harvesting practices at many Amazonia forest sites are not sustainable in the long term (Peres et al. 2003).
Discussion • All kinds of explanation or forming of questions should be stated here. • Discuss similarities and differences between different papers. • Similar results by other scientists should be used to support your result. • Documentation of different results is important to throw light on differences in f. instance methodology, or simply that the issue is more complex. Differences could also be used to put focus on a situation. • Ex. Nesheim et al. page 121 in the compendium. • Build up arguments based on findings • “The process of knowledge transmission have changed form long-term learning to short-term learning and may be part of the reason why people have changed their resource use and consumption pattern” Nesheim et al. 2006.
Discussion • Put in text documentation and source information in proper form, i.e. remember references.. • A statement should be supported by other research • A similar finding should be referred for support to your finding. • It is allowed to speculate, but be aware of speculation that is not documented.
Conclusion • Draw the lines. • Comments, that is comments on possible implication and suggestions for further research. • Don’t report conclusions that are unsupported by your actual research. • Don’t introduce new material. • In most natural science papers, the conclusion is part of the discussion..