Polynomial Functions: Evaluation and Graphing Guide
100 likes | 136 Vues
Learn about polynomial functions, evaluation, and graphing techniques including determining degree, type, and leading coefficient. Understand end behavior as x approaches infinity or negative infinity. Examples included.

Polynomial Functions: Evaluation and Graphing Guide
E N D
Presentation Transcript
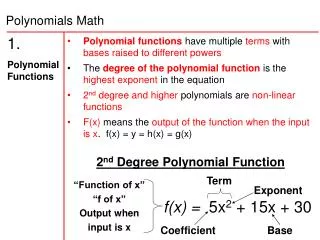
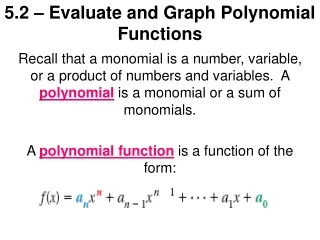
5.2 – Evaluate and Graph Polynomial Functions Recall that a monomial is a number, variable, or a product of numbers and variables. A polynomial is a monomial or a sum of monomials. A polynomial function is a function of the form:
5.2 – Evaluate and Graph Polynomial Functions an cannot be zero The exponents are all whole numbers Coefficients are all real numbers an is the leading coefficient n is the degree a0 is the constant term A polynomial is in standard form if its terms are written in descending order of exponents.
5.2 – Evaluate and Graph Polynomial Functions Example 1: Decide whether the function is a polynomial function. If so, write it in standard form and state its degree, type, and leading coefficient.
5.2 – Evaluate and Graph Polynomial Functions Example 2: Use direct substitution to evaluate f(x) = 2x4 – 5x3 – 4x + 8 when x = 3.
5.2 – Evaluate and Graph Polynomial Functions Example 3: Use direct substitution to evaluate f(x) = x4 + 2x3 +3x2 – 7 when x = -2.
5.2 – Evaluate and Graph Polynomial Functions The end behavior of a function’s graph is the behavior of the graph as x approaches positive infinity or negative infinity. For the graph of a polynomial function, the end behavior is determined by the function’s degree and the sign of its leading coefficient.