Download
1 / 27
270 likes | 428 Vues
C+V Satellite Applications. Rich Bankert Satellite Meteorological Applications Section. Naval Research Laboratory Marine Meteorology Division Monterey, California. Ceiling and Visibility Science Meeting 19 April 2001. GOES CLOUD CLASSIFICATION.

E N D
C+V SatelliteApplications Rich Bankert Satellite Meteorological Applications Section Naval Research LaboratoryMarine Meteorology Division Monterey, California Ceiling and Visibility Science Meeting 19 April 2001
GOES CLOUD CLASSIFICATION Objective: Automate the cloud analysis of GOES imagery (day or night; land or sea) in terms of traditional cloud types, clear, snow, etc. Approach: Supervised learning methodology * Expertly-labeled image samples (training data) * Characteristic features computed/extracted from the five GOES channels with a subset of features chosen as a result of the application of a feature selection algorithm * 1-Nearest Neighbor algorithm employed as the classifier using the training data represented by the selected features * Web-based evaluation of real-time imagery by experts
GOES Cloud Classifier Development * Supervised Learning * Expertly labeled 16km x 16km samples from GOES-WEST and GOES-EAST (2/99 – 8/00) * Samples independently classified by three experts * Those samples with all three expert agreement are used in the training data * Four classifiers Sea Day: 5937 samples, 14 classes Sea Night: 3875 samples, 12 classes Land Day: 5313 samples, 15 classes Land Night: 4109 samples, 15 classes Red boxes indicate classified sample area
GOES Cloud Classifier Development Additional Details * Visible channel is 1 km resolution * Sample is 16 pixel x 16 pixel * Shortwave and longwave Infrared channels are 4 km resolution * Sample is 4 pixel x 4 pixel * Visible channel data is solar zenith angle corrected (albedo / cos(sza)) * Daytime classifiers are used when majority of pixels have sza less than 75 degrees Red boxes indicate classified sample area
Feature Extraction andSelection • Image feature characteristics extracted/computed from all five channels • Over 100 features for daytime; 45 for night • Feature vector intelligently chosen (feature selection algorithm) for • each classifier • Feature vector used to represent each training sample (and real-time • samples) in the classifier • Example Features • Visible channel textures (contrast, smoothness, disorder, etc) • Simple statistics for each of the five channels: max, min, mean, std dev • Statistics for channel difference images • Latitude, Satellite, Date • Climatological SST
Selected Features Sea Day Selected Features Satellite (GOES East or GOES West) Latitude Date Channel 1 Median and SD Channel 2 Max and Mean Channel 3 Max Channel 4 Min, Range, and Mean Channel 5 Median (Channel 4 – Channel 5) Mean Two Channel 1 Textures Climatological SST Land Day Selected Features Satellite (GOES East or GOES West) Latitude Date Channel 2 Min and Median Channel 3 Median Channel 4 Max, Range, and Median Channel 5 Min, Median Four Channel 1 Textures
GOES Cloud Classifier Algorithm 1-nearest neighbor algorithm Feature Space A Similarity Distance is computed between a testing sample and EACH training sample. Σ (testing featurei – training featurei)2 Testing sample is classified with the class of the training sample with the minimum similarity distance. Cu ? - Cu Training sample (class known) Testing sample (class unknown)
GOES Cloud ClassifierReal Time Procedure Individual pixel is classified four times (except on domain edges)
GOES Cloud ClassifierReal Time Procedure * Individual pixel is classified four times with pixel class determined by “voting” – ties broken by random selection * Along coast lines – classifier choice determined by pixel majority Post processing * General class groupings (Low, Mid, High, Vertical, etc) * Check individual pixel for visible albedo threshold If < 12% then pixel re-classified as clear
Current Real Time Classification Algorithm GVAR stream received at NRL Calibrated/Navigated Data Terascan Data Format (TDF) Files • C-shell scripts launched • Set classification and terascan environments • Define directory paths • Log file created • Find latest TDF file • Define image sub-area • Calculate lat, lon, sza (terascan functions) • Create land/sea table (terascan) • Call 1-nearest neighbor executable • Classification Executable • C and Fortran • Extract TDF channel data (terascan) • For each sample in an image sub-area: • Determine appropriate classifier • Compute features • 1-nearest neighbor algorithm • determines class type for each • pixel in sample • Determine “final” class for each pixel in • image sub-area • Pixel albedo check (clear) • General class groupings output • Create TDF output file (terascan) • C-shell scripts • Call terascan functions to create channel and classification jpgs for web display
GOES Cloud Classifier Display 15-class output Visible Channel Land/Sea Day Classifier Output
GOES Cloud Classifier Display 8-class groupings IR Channel General Class Output
GOES Cloud Classifier Example Visible Channel Land/Sea Day Classifier Output
GOES Cloud Classifier Example Visible Channel Land/Sea Day Classifier
GOES Cloud Classifier Limitations * Mixed cloud samples • Thin cirrus over low clouds • Cloud edges (e.g, Cs shield) * “Never enough training data” • Low clouds in arctic air over Eastern Canada * Snow/Low cloud misclassification * Nighttime classifications may only be useful in general classes
GOES Cloud Classifier SubjectiveEvaluation * Web display created for expert evaluation in real time * Daytime classifications are well done EXCEPT * Thin Ci over low clouds – mid cloud classification * Snow overdone (actual low clouds misclassified) * Mid/High clouds overdone in cold air * Qualitative assessment of additional limitations, robustness, usefulness, problem areas that may be correctable, etc. * Evaluation performed and documented throughout the year (all seasons)
Low Cloud Detection at Night using GOES Imager Nighttime Low Clouds: By subtracting the shortwave/ longwave channels, low clouds appear in white. Nighttime IR: Can’t see low because lack of contrast with background
Low Cloud Product using GOES Imager ADVANTAGES Ability to view low clouds around the clock Useful for unobserved areas like oceans where surface reports of low clouds, fog or poor surface visibilities are rare. LIMITATIONS Can not distinguish between low stratus clouds and actual fog The nighttime images are only useful for stratus, fog, or stratocumulus They will not perform well over cumulus clouds GOES visible is 1km (day), but IR channels are 4km (night)
Methodology Behind Blended Microwave and Geo-Infrared Data for an Operationally-Based Precipitation Analysis • Principle:Microwave-based (SSM/I, TRMM, AMSU, etc) rain • estimates are physically-based but infrequent; infrared-based (IR) • estimates are indirect but updated at least hourly and provide high • temporal, multi-spectral, and spatial information • Real-Time Adjustment: Utilize near realtime microwave-based • data to dynamically adjust the IR over global space-time domains • Accommodate operational applications: Nearest-time microwave • data may be several hours old, whereas clouds have been evolving • since then. Utilize MW data for rain microphysics, IR data for space- • time cloud evolution, NWP model data for dynamics
6-hour number-of-points from geostationary-based technique 2000/04/27 1200 UTC GOES-East GOES-West Meteosat Meteosat-5 GMS 6-hour number-of-points from merged microwave sensors (F-11,13,14,15; TRMM)
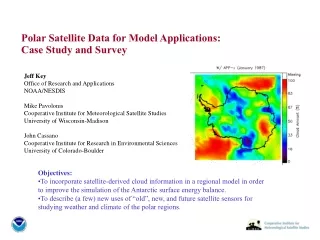
Observing Dust Storms From Space The Problems with Dust • Visibility plays an important role in many Naval operations. • Strong winds blowing across the expansive deserts of Aftrica and the Middle-East lift giant dust plumes airborne. • These plumes can extend for thousands of miles beyond their places of origin. • Heavy dust storms lead to poor surface visibility and the potential for causing serious damage to jet aircraft engines. SeaWiFS Image: February 13, 2001 at 1255 Universal Time SPAIN The Satellite and Sensor A • The Sea-viewing Wide Field-of-view Sensor (SeaWiFS) instrument (Fig. A) has 8 channels in and around the visible part of the spectrum. • It is carried aboard the polar-orbiting SeaStar satellite (Fig. B) at an altitude of 705 km, with a spatial resolution of 1-km. Saharan Dust The Science B • Airborne dust produces a different spectral contrast against the ocean than water or ice clouds. • Combining information from the SeaWiFS channels enables us to generate products that enhance this contrast in the satellite image. Canary Islands. AFRICA An Example • The SeaWiFS image in Fig. C captures a dust storm (yellow plume) from the Western Sahara desert in Africa as it streams Northward around the Canary Islands toward Portugal, where it wraps into the large-scale flow of a low pressure system (comma shape). • The strong contrast of the dust against the blue ocean provides a clear indicator for operational use. C Naval Research Laboratory Satellite Applications Section Poster POC: Steven D. Miller (miller@nrlmry.navy.mil)
Satellite-Derived Convective Cloud Top Heights GOES-10/GMS-5 Infrared Image Motivation and Method • Knowledge of thunderstorm (convective) cloud top altitudes is important to commercial and DoD aircraft in order for pilots to avoid hazards such as heavy turbulence or lightning. • The NRL Convective Cloud Top Height product uses the cloud top temperature from a satellite measurement and translates this to an equivalent height in the atmosphere. • The method combines infrared (10.7 m) imagery from various Geostationary satellites and profiles of temperature with height from the Navy Operational Global Atmospheric Prediction System (NOGAPS) to estimate these heights. • Geostationary data are used to provide a time series of clouds as they deepen/dissipate. An Example Derived Cloud Top Heights 10,000ft 70,000ft • Shown above is an color-enhanced infrared image covering part of the Tropical Western Pacific ocean. Cold cloud tops appear white, and warmer clouds are increasing shades of gray. • The ocean background is depicted here as blue (but would appear black in a normal infrared image since it is very warm compared to the high clouds in the scene). • The corresponding cloud heights (expressed in thousands of feet) are shown in the figure at right. For reference, typical standard cruising altitudes for commercial airliners are between 30,000 and 40,000 ft. The highest cloud top in the image is near 54,000 ft! • Knowing the whereabouts of these deep towers of convection is key to aviation safety, especially at night when the view ahead is limited by airborne radar. Naval Research Laboratory Satellite Applications Section Poster POC: Steven D. Miller (miller@nrlmry.navy.mil)
Cloud Top Height Strengths/Weaknesses Strengths Over ocean (warm, stable background). Optically Thick Clouds. Tropical Profiles (steady lapse rates, few inversions, well-defined tropopause). Weaknesses Over land (highly variable temperature background diurnally). Optically thin clouds (leading to underestimation of true cloud height). Profiles with strong mid-level inversions of temperature. Low clouds. The figure above illustrates one of the benefits of using NOGAPS model profiles instead of the standard atmosphere when mapping satellite temperature to equivalent height. The model profile (blue) matches closely with the rawinsonde (green).
NRL Satellite Products Web Site http://kauai.nrlmry.navy.mil/sat_products.html * GOES cloud classification not yet available