Download
1 / 66
670 likes | 898 Vues
Employment Outlook: 2000-2010. National employment projections http://www.bls.gov/emp. State projections http://almis.dws.state.ut.us/occ/projhome.asp. Employment Outlook: 2000-2010. Labor force Economic growth Industry employment Occupational employment. Number of live births, 1920-2000.

E N D
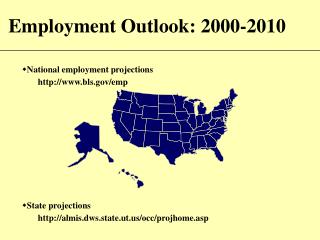
Employment Outlook: 2000-2010 • National employment projections • http://www.bls.gov/emp • State projections • http://almis.dws.state.ut.us/occ/projhome.asp
Employment Outlook: 2000-2010 • Labor force • Economic growth • Industry employment • Occupational employment
Number of live births, 1920-2000 Millions Babyboomers
Population growth rates Annual rates of change projected Source: Bureau of Labor Statistics
Growth rates of the civilian labor force, ages 16 and older Annual rates of change projected Source: Bureau of Labor Statistics
Men Women Age 85+ 80-84 75-79 70-74 65-69 60-64 55-59 50-54 45-59 40-44 35-39 30-34 25-29 20-24 15-19 10-14 5-9 0-4 0 6 8 10 12 12 10 8 6 4 2 0 2 4 Population, projected 2010 Millions Source: Bureau of the Census
Women’s labor force participation rates will continue to rise Percent, 1950-2000 and projected 2000-2010 Men Total Women Source: Bureau of Labor Statistics
Labor force growth rates of minorities will outpace that of whites Percent change, projected 2000-2010 Source: Bureau of Labor Statistics
Employment Outlook: 2000-2010 • Labor force • Economic growth • Industry employment • Occupational employment
The 2000-2010 projections assume a 3.4 percent real GDP growth rate Percent projected Source: Bureau of Labor Statistics
The 2000-2010 projections assume a 2.4 percent labor productivity growth rate Percent projected Source: Bureau of Labor Statistics
Annualized growth rates in productivity during recessions Percent 1953-54 1957-58 1960-61 1969-70 1973-75 2001 1981-82 1990-91 1980 Source: Bureau of Labor Statistics
The 2000-2010 projections assume a 4 percent unemployment rate Percent assumed Source: Bureau of Labor Statistics
Gross Private Domestic Investment expenditures increased as a share of GDP during the 1990s Percent Imports PCE Exports Investment Government Source: Bureau of Labor Statistics
Computer equipment’s and software’s rising share of Gross Private Domestic Investment Percent Computer equipment Software Source: Bureau of Labor Statistics
Employment Outlook: 2000-2010 • Labor force • Economic growth • Industry employment • Occupational employment
Service Producing Goods Producing Manufacturing and services accounted for nearly half of total output in 2000 Billions of chained 1996 dollars Source: Bureau of Labor Statistics
Service Producing Goods Producing Services and retail trade accounted for 43 percent of jobs in 2000 Thousands of nonfarm wage and salary jobs in 2000 Source: Bureau of Labor Statistics
Output and employment shares of goods-producing industries, 2000 Percent Source: Bureau of Labor Statistics
Output and employment shares of service-producing industries, 2000 Percent Source: Bureau of Labor Statistics
Services and retail trade account for most job growth Thousands of nonfarm wage and salary jobs, projected 2000-2010 Service Producing Goods Producing Source: Bureau of Labor Statistics
Engineering and management services Projected 2000-2010 employment growth in services is concentrated Thousands of nonfarm wage and salary jobs Total: 12,893 Business Health services services 2,838 5,064 2,505 1,260 1,225 All other services Social services Source: Bureau of Labor Statistics
Employment Outlook: 2000-2010 • Labor force • Economic growth • Industry employment • Occupational employment
Professional and related occupations had the most jobs in 2000 Millions of jobs Source: Bureau of Labor Statistics
All major occupational groups are projected to increase Percent change, projected 2000-2010 Source: Bureau of Labor Statistics
Computer software engineers, applications Computer support specialists Computer software engineers, systems software Network and computer systems administrators Network systems and data communications analysts Desktop publishers Database administrators Personal and home care aides Computer systems analysts Medical assistants Eight of the fastest growing occupations are computer-related Percent change, projected 2000-2010 100 Source: Bureau of Labor Statistics
Large Rapidly growing Occupations with the most job growth are large or rapidly growing Numerical change in thousands, projected 2000-2010 Combined food preparation and serving workers, including fast food Customer service representatives Registered nurses Retail salespersons Computer support specialists Cashiers, except gaming Office clerks, general Security guards Computer software engineers, applications Waiters and waitresses Source: Bureau of Labor Statistics
BLS estimates there were 3.3 million IT workers in 2000 using the 2000 Standard Occupational Classification System • Computer and information systems managers • Computer specialists • Computer programmers • Computer scientists and systems analysts • Computer software engineers • Database administrators • Computer support specialists • Network and computer systems administrators • Network systems and data communications analysts • All other computer specialists • Computer hardware engineers
IT occupations — managerial 1Includes wage & salary, self-employed, and unpaid family workers. 2Based on OES occupational employment data for wage and salary workers. Source: Bureau of Labor Statistics
IT occupations — professional and related 1Includes wage & salary, self-employed, and unpaid family workers. 2Based on OES occupational employment data for wage and salary workers. Source: Bureau of Labor Statistics
IT occupations — professional and related 1Includes wage & salary, self-employed and unpaid family workers. 2Based on OES occupational employment data for wage and salary workers. Source: Bureau of Labor Statistics
IT occupations — professional and related (cont.) 1Includes wage & salary workers, self-employed, and unpaid family workers 2Based on OES occupational employment data for wage and salary workers. Source: Bureau of Labor Statistics
IT employment estimates differ substantially across different studies • Information Technology Association of American (ITAA) • U.S. Department of Commerce • Economics and Statistics Administration (ESA) • Office of Technology Policy (OTP) • Current Population Survey (CPS)
Information Technology Association of America (ITAA) • ITAA defines an IT worker according to the eight career clusters established by the National Workforce Center for Emerging Technologies (NWCET). • Database administration and development • Digital media • Enterprise systems analysis and integration • Network design and administration • Programming/Software engineering • Technical support • Technical writing • Web development and administration
Information Technology Association of America (ITAA) ITAA estimates of IT employment: 10.4 million IT workers in 2001 9.9 million IT workers in early 2002
U.S. Department of Commerce (Economics and Statistics Administration) • ESA defines IT workers as those who design, manufacture, operate, repair, and maintain the IT infrastructure that facilitates e-commerce and other Internet or network-related activities. • The ESA divided the IT workforce into two partially overlapping groups— workers in IT-producing industries workers in IT occupations.
U.S. Department of Commerce (Economics and Statistics Administration) • Workers in IT-producing industries include all occupations, (i.e. sales, marketing, and financial services), in addition to workers in IT occupations. • IT-producing industries consist of four major segments: hardware, software and related computer services, communications equipment, and communications services.
U.S. Department of Commerce (Economics and Statistics Administration) • Workers in IT occupations design, manufacture, operate, maintain, and repair IT products and provide related services across all industries, not just in IT producing industries. • The Economics and Statistics Administration selected 30 IT-related jobs from Bureau of Labor Statistics/OES job classification.
U.S. Department of Commerce (Economics and Statistics Administration) 2000 ESA estimates: 5.6 million – size of workforce in IT industries 6.7 millions workers in IT related occupations
U.S. Department of Commerce (Office of Technology Policy) • Defines the core IT workforce as: • computer engineers, • system analysts, • computer programmers, • database administrators, • computer support specialists • all other computer scientists. • Based on pre-2000 SOC BLS/OES job classifications. • 2.2 million IT workers in 1998
Current Population Survey Occupation OEP Employment, 2000 (thousands) CPS Employment, 2000 (thousands) Computer and information scientists, research 28 --- Computer systems analysts 431 --- Total 459 1,797 Computer programmers 585 699 Source: Bureau of Labor Statistics
High technology defined • Industries are considered high tech if employment in R&D and in all technology-oriented occupations accounted for a proportion of employment that was at least twice the average for all industries in the Bureau’s Occupational Employment Statistics survey.
High technology defined (cont.) • Twenty-nine industries, 25 in manufacturing and 4 in the services division, met both criteria. These industries have at least 6 R&D and 76 total technology-oriented workers per thousand workers. • A subset of 10 high-tech industries, those with both ratios at least 5 times the average, is referred to as high-tech intensive industries. These industries have at least 15 R&D and 190 total technology-oriented workers per thousand workers.
High technology defined (cont.) • High tech intensive industries include computers and other electronics-based industries, aerospace, research laboratories, and drug manufacturing. • Other high-tech industries are machinery and motor vehicle manufacturing, chemicals, engineering services, and management consulting.
High-tech employment Millions of wage and salary jobs 14.0 10.7 9.1 Source: Bureau of Labor Statistics