Download
1 / 70
710 likes | 879 Vues
Mapping Engineering Constraints from Orbit to the Surface Or How to Certify a Landing Site. Matt Golombek Jet Propulsion Laboratory. How to Certify a Landing Site on Mars?. Selecting landing site critical decision

E N D
Mapping Engineering Constraints from Orbit to the Surface Or How to Certify a Landing Site Matt Golombek Jet Propulsion Laboratory
How to Certify a Landing Site on Mars? • Selecting landing site critical decision • If the spacecraft doesn’t land safely there is nothing to show for the effort (and money) • Mission success rests on safe site (including all science) • Fate of a spacecraft (hundreds millions of dollars) • Must learn everything possible about the site • It is one thing to write a science paper about some topic, it is something else entirely to risk an entire mission on the interpretation • Engineering Constraints - Derive from s/c and EDL • Address Engineering Constraints with Remote Sensing Data • Mapping Engineering Constraints to Atmosphere and Surface - Better do this, better can select safe site
Outline • PERSPECTIVE • MER EXAMPLES • Possible Sites • Data Used to Evaluate Sites • How the Data was Used • How Site was Certified • Assessment of Landing Site Predictions • EXPECTATIONS FOR MSL • Data Sets • Addition of MRO Data • Certification Process
Landing Sites on Mars VL2 VL1 MPF Meridiani Gusev
Golombek’s Perspective • Viking - "The blind leading the blind" • Predictions of the surface were incorrect, but the atmosphere was within specifications • Most importantly they both landed successfully • Pathfinder - "Take your best shot" • Little new data since Viking Mission, but much greater appreciation of how VL1 and 2 landing surfaces relate to Viking Orbital data • Clear Earth analog near mouth of catastrophic outflow channel • Surface and atmospheric predictions were correct • MER - "Never has so much data been acquired of and so much work done on 4 small spots on Mars" • An unprecedented explosion of information from MGS and Odyssey resulted in the best imaged, best studied 4 spots in the history of Mars exploration • The major engineering concerns were addressed by data and scientific and engineering analyses suggested the sites were safe • Data allowed detailed exposition of testable scientific hypotheses at the sites - became template for surface operations • Surface and atmospheric predictions (wrt safety) were correct
Preliminary MER Engineering Constraints • ATMOSPHERE - ELEVATION • Must be <-1.3 km [wrt MOLA geoid] for Parachute • Atmospheric Column Density, Low-Altitude Winds <20 m/s • LATITUDE 5°N TO 15°S for MER-A and 15°N to 5°S for MER-B • Solar Power, Temperature, Sub-Solar Latitude; 37° Lander Separation • Ellipse Size and Orientation, Lat. Dep. – Varied w/simulations • SURFACE SLOPES <6° RMS (<15°) • Mesa Failure Scenario; Radar Spoof; Lander Bounce/Roll; Rover Deploy; Power; Later <2° at 1 km; <5° at 100 m; <15° at 3-10 m • ROCKS • <1% Area Covered by Rocks >0.5 m High for Landing • Athena Rover Trafficability - Total Rock Abundance of <20% • Athena Wants Rocks – It is a Rock Mission • DUST • Must Have Radar Reflective Surface – Descent Altimeter • Load Bearing and Trafficable Surface • Reduce Lifetime, Coat Solar Panels, Rocks & Instruments
Landing Sites on Mars VL2 VL1 MPF 15°N Elysium Isidis Meridiani 15°S Gusev
Data Used to Evaluate Landing Sites • Viking Images - 230 m/pixel MDIM (Base Map) • MOLA • Definitive Elevation, geoid, atmospheric pressure wrt geopotential • Definitive Slopes at 1 km Scale • Pulse Spread - RMS Relief at ~100 m Scale • 100 m Roughness & Slope from Relief 3 km to 300 m Extrapolated via Hurst Exponent (Self Affine) • Shaded Relief Maps • Thermophysical Properties • IRTM Thermal Inertia, Fine Component, Rocks, Albedo [~1°] • TES Thermal Inertia & Albedo [3 km], Surface Temperature • Dust Cover Index - TES Thermal Inertia and Particle Size • THEMIS - Thermal Images [100 m], Surface Temperature
Data Used to Evaluate Landing Sites • Rocks • Abundance from IRTM Spectral Differencing; % Rocks >0.1-0.15 m Diameter Covering Surface • Model Size-Frequency Distributions; Potentially Hazardous Rocks; Comparison to Test Platform Rock Distributions • Boulders Visible in MOC Images • MOC and THEMIS Imaging Data • MOC Images at 1.5-6 m/pixel; Nadir MOLA Shots along image • THEMIS Visible Images at 18 m/pixel • Stereogrammetry & Photoclinometry • 10 m and 3 m DEMs (Digital Elevation Models); Slopes • Radar Reflectivity and Roughness (RMS Slope) • X (3.5 cm)- and S (12.6 cm)-Band: Goldstone & Arecibo • Reflectivity • Specular and Diffuse Scattering
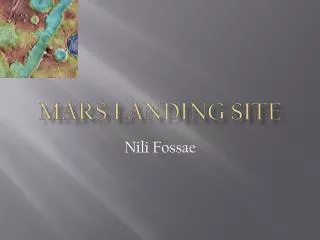
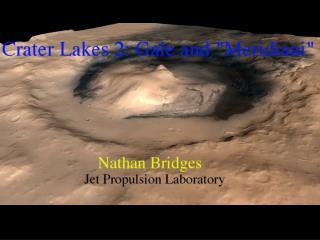
GUSEV CRATER Clear Morphologic Evidence for Water High Preservation Potential of Environment in Deposited Sediments
Gusev Crater Lake Sediments Cratered Surface - No Layers Obvious Etched Terrain Dark Streaks Dusty 2 km
Meridiani Planum (Hematite) Site (MER - B)
TERRA MERIDIANI Smoothest, Flattest Place in Equatorial Mars
Meridiani Dark Surface Unit Bright Dunes Bright Underlying Unit
General Landing Site Predictions • Broad predictions [Golombek et al., 2003] • Safe for Landing • Trafficable for Rover • Meridiani • Completely Unlike other Landing Sites, Very Few Rocks, very little dust • Dark Gray Plain of Sand and Granules with Discontinuous Outcrops of Bright Units that Surface from Beneath • Gusev • Similar to VL Landing Sites, Less Rocky and Moderately Dusty • Dust Devil Tracks in THEMIS Images (would be exception)
Spirit Landing Site - Gusev Crater Broadly Similar to VL Sites Dusty, Moderately Rocky
How Well Did Remote Sensing Data Predict Surface? • All Predictions Correct • Thermal Inertia, Rock Abundance, Albedo • Elevation, Slope (1 km, 100 m, 5 m), Roughness • Important Because • Use landing sites as “ground truth” for orbital data • Essential for selecting & validating landing sites for future missions • Correctly interpret surfaces, kinds of materials globally present on Mars • Use Similar Method for MSL Landing Sites Golombek et al., 2005
Surface Characteristics THERMOPHYSICALPROPERTIES • Thermal Inertia - • Resistance of Surface Materials to Change in Temperature • Dependent on Particle Size or Cohesion • Is the Surface Load Bearing/Competent? • How Much Dust/Rocks? • Surface Characteristics
TES Thermal Inertia Putzig et al., 2005 Dust Cover Index Albedo Ruff and Christensen, 2002
Putzig et al.2005 TES Global Albedo vs Thermal Inertia Meridiani-B Gusev-C A - Dust B - Dark C - Dusty, Crusty, Rocky 78% Mars
THERMAL INERTIA • Meridiani - Bulk Thermal Inertia (I) ~200 SI units • Predicted to be Sand 0.2 mm • Gusev ~300 Si Units • TES/THEMIS Observations Similar to MiniTES Predicted to be Competent and Load Bearing Cemented Soils/Duricrust, Sand and Granules No Thick Deposits of Cohesionless Dust No Special Risk to Landing or Roving Golombek et al., 1997
THEMIS Thermal Inertia Over THEMIS Visible (18 m/pixel) Landing Site in Low Inertia Plains - 285 Legacy Pan Partway up Ejecta - 290 Bonneville on Crater Rim - 330 Golombek et al., 2005 Fergason et al., 2006
Surface Characteristics ROCKS • Thermal Inertia - • Rock Abundance • Size-Frequency Models • Probability Impact • Boulder Fields - • Rock Abundance • Comparison to Test Surfaces - • Airbag Capabilities
Rock Abundance on Mars IRTM Thermal Differencing 1° x 1° Pixels Mode is 8% N. Plains Are Rocky Christensen, 1986
Rock Abundance • Rocks - IRTM Orbit (±5%) • Gusev 7-8% ellipse, 7% pixel • Meridiani 5% ellipse, Few% pixel • Measured at Surface • Spirit 4% at Land Site • >0.1 m Diameter • 5% & 30% Towards Rim Bonneville • Size-Frequency Distribution Similar to Model D>0.1 m • Meridiani Outcrops are Rocks • Consistent Few % Surface Coverage • Now Sampled Full Spectrum of Rock Abundance Surfaces on Mars • Safe for Landing • Benign for Roving Golombek et al., 2005
Bulk I Versus Rock Abundance For Lines of Constant Fine Component I for Effective I Rock of 2100 (dashed lines) & 1300 (solid lines) - 20% Possible Rock Abundance Change Golombek et al. [2003] For Bulk Inertia and Derived Effective Inertia of the Rock Population Can Derive Fine Component Thermal Inertia Golombek et al., 2003
100 m Gusev Boulder Fields Golombek et al., 2003
GUSEV ELLIPSE Boulder Fields Outside Ellipse Inside Ellipse Boulder Field Size Identified Gusev Boulder Fields
Boulder Size-Frequency Distributions • Boulder Fields Rare • ~0.1% of MOC Image • Low Sun >38° • Plotted Max Subareas • Ave, Min 2-10 x Lower • Extreme Distributions • Steep Slope, Exponential Decay • Similar to Model Dist. • ~1% Surface Covered by 3-10 m Diameter Boulders • Can’t See Boulders at 3 Landing Sites, 20% • If Can’t See, <20% Rock Abundance • Formal Probability Analysis • 0.2-2% Chance Impacting Boulder in Boulder Field Golombek et al., 2003
Airbag Drop Test Platform 60° Dipping Platform at Plum Brook Largest Vacuum Chamber in World Fully Inflated Airbags Around Full Scale Lander Bungee Chord Pulls Lander to Impact Velocities Airbags Impact First at Edge Between Tetrahedrons & Then Rotates to Face
ELEVATION • MOLA Topography & Geoid Excellent for Landing Site Evaluation • Spirit located at 14.5692°S, 175.4729°E at -1940 m • Tracking Results, 14.5718921°S, 175.47848°E; Radial Elevation 3392.2997±0.001742 km • Geoid of Closest MOLA point -14.56903°S 175.47075°E, 3394.2367 km, minus elevation, 3392.2967 km, Difference of 3 m, within uncertainty • Opportunity located at 1.9462°S, 354.4734°E at –1385 m • Tracking Results 1.9482823S, 354.47417°E; Radial Elevation 3394.1482±0.0004683 km • Geoid of Closest MOLA point -1.94539°S, 354.48697°E, 3395.5351 km minus elevation is 3394.14816 km, which is within 0.04 m • Actually do not know exactly where any particular MOLA elevation shot is to ±300 m, so uncertainties in map tie and ability to read elevation from map overwhelm comparison
Atmosphere Models Limb Mean Profile • Surface T, P and wind time series • VL1, VL2, MPL) • Remote soundings of T profiles • TES • Almost 3 Mars years • ~10 km vertical resolution • Inaccurate near the surface • Viking IRTM • Radio Occultations • Mariner 9 IRIS Limb Profiles Nadir Mean Profile Baseline Profile Binned Nadir Profiles Kass et al., 2003
Meridiani Planum ~ 1pm LTST East-West cross section vertical wind Strong convection narrow upwellings broad downwellings hexagonal pattern Extends ~ 5 km vertically Modest horizontal winds ~4 m/s average random directions Peak upward velocity ~ 6.5 m/s Peak downward velocity ~3.5 m/s Rafkin et al., 2003
Mesoscale Wind Model Results 3-D dynamical atmospheric models Model meteorological phenomena at the 2 to 200 km scale Track pressure, temperature, and wind vectors Kass et al., 2003
Atmospheric Profile & Winds • Atmospheric Model VL1 (adj. elev.), TES T Profiles & MGCM Weather (D. Kass) • Density Derived from Deceleration Profile & Aeroshell Properties • Derived Temperature Profile • Within 5K Spirit, warm below 15 km, cool above • Within 15K Opportunity • Profile within 1 standard deviation (low) bounds of atmospheric model • Overestimated mean density by 8% uncertainties below 5 km • Winds Appear within Expectations based on Mesoscale Models • Gusev Greater Horizontal Winds • Both Experienced Updrafts Golombek et al., 2005
TES Albedo Versus Thermal Inertia Adjusted Meridiani Ellipse to Minimize Cold Nighttime Temperatures
Surface Characteristics SLOPES • 1 km Slopes - • <2° To Reduce Continuous Role • 100 m Slopes - • <5° To Prevent Radar Spoofing • 5 m Slopes - • <15° To Reduce Airbag Bounce & Spinup
MERIDIANI Bidirectional Anderson et al., 2003
Elysium 1.2 km Slope Bidirectional Slope Anderson et al., 2003
Meridiani 100 m Slope MOLA Pulse Spread 150 m Scale Roughness Garvin 100 m Slope Derived from Allen Variation/Hurst Exponent Haldemann et al. Anderson et al., 2003
1 km and 100 m Statistics Golombek et al., 2003
Gusev 10 m DEM Kirk et al., 2003
5 m Slopes • Meridiani Smoothest • RMS Slopes Very Low • Elysium Next Smoothest • RMS Slopes Comparable to MPF • Isidis Slightly Rougher • Has Rougher Terrains in Ellipse • Gusev is the Roughest • Has Roughest Terrains in Ellipse • MOC Stereo - 10 m, PC-Photoclinometry generally ~3 m; • Corrected to 5 m Kirk et al., 2003
SLOPE • 1.2 km Scale Slopes Lowest at Meridiani [0.15°& 0.24°; 0.3°] and Lower at Gusev [0.2° and 0.19°; 0.5°] than at VL or MPF 100 m • 100 m Slope Lowest at Meridiani [1.9°; 0.7°] and Lower at Gusev [3.3°; 1.4°] than at VL1 (comparable to VL2) or MPF • 5 m RMS Slope (MOC DEM) Lowest at Meridiani and Lower at Gusev than at MPF [2° & 4°]; 1.4° & 2.5° • Consistent with Extraordinarily Smooth and Flat Surface at Meridiani (smoothest, flattest place investigated) and Reasonably Smooth & Flat Surface at Gusev • RMS Slopes from Rover Traverse Telemetry
Surface Characteristics RADAR • Is the Surface Radar Reflective? Reflectivity >0.02 • Will the Descent Radar Altimeter Function Correctly? • Does the Surface Have a Reasonable Bulk Density? • Is the Surface Load Bearing? Safe for Landing & Roving • Surface Roughness • RMS Slope <6°