Soil pH, Conductivity, and Nutrient Dynamics Over Time in Agricultural Practices
80 likes | 197 Vues
This report presents a comprehensive analysis of soil properties over time, focusing on pH variations (Fig. 1), soil water conductivity trends (Fig. 2), and the impact of fertilization on soil mass loss and nutrient content. The data indicates a decline in soil conductivity modeled by an exponential decay function, with a half-life of 2.4 years. Additionally, soil pH and organic matter were influenced by different fertilizer treatments, while nitrate levels varied with distance from treatment sites (Figs. 4-5). Plant cover dynamics over time are also discussed.

Soil pH, Conductivity, and Nutrient Dynamics Over Time in Agricultural Practices
E N D
Presentation Transcript
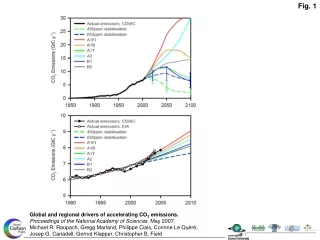
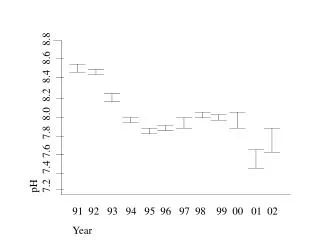
Fig 1. Surface pH against time. pH 7.2 7.4 7.6 7.8 8.0 8.2 8.4 8.6 8.8 • 92 93 94 95 96 97 98 99 00 01 02 • Year
Figure 2. Conductivity of soil water against time. The declining phase is modelled by the function y = 4.69*exp(-0.29*(year-1993)) hence T½ = 2.4 years Figure 2: Conductivity of soil water against time Conductivity, mS cm-1 0 2 4 6 8 10 12 • 92 93 94 95 96 97 98 99 00 01 02 • Year
Figure 3: Soil mass loss on ignition vs time % Loss on ignition 0 5 10 15 20 • 92 93 94 96 97 98 00 01 02 • Year
Figure 4. Soil surface pH and organic matter as a function of fertiliser treatment. b c pH 7.9 8.0 8.1 8.2 8.3 10 11 12 13 %LOI ab b a a None Chemical Organic Fertiliser treatment
Figure 5: Soil nitrate against distance from site centre at the final harvest in 2002 y = 0.19 + 0.016*X r = 0.33** NO3, mg 100g-1 0 0.25 0.5 0.75 1.0 c c 0 5 10 15 distance from centre of site, m
Fig 6: % Plant cover against time as a function of initial fertilizer treatment Mean % cover, bars show 1s.e. 0 20 40 60 80 100 Control Chemical Manure 91 92 93 94 95 96 97 98 99 00 01 02 Year
Key 91-94 95-98 99-02 Ca Figure 7. DCA ordination of the floral data Lc Fa Di Vt Ap -100 0 100 200 300 400 Cr Bg 2nd DCA axis (Eigenvalue = 0.265) Sm c Pm Fh Mo Lc Vm Lg Hl Dc Vc Hr -100 0 100 200 300 400 500 1st DCA axis (Eigenvalue = 0.599)