A Visualization System for Tidal Basins
This proposal outlines the development of a graphical visualization system aimed at enhancing the analysis of tidal basins for the Coastal Engineering sector. The project will automate the manual process currently reliant on Excel, providing a user-friendly interface to visualize important properties like depth, elevation, and water velocity in real-time. By employing techniques such as data mapping, color coding for concentration levels, and velocity vector representation, the system will facilitate better understanding and management of coastal erosion, pollution, and navigational access challenges.


A Visualization System for Tidal Basins
E N D
Presentation Transcript
A Visualization System for Tidal Basins Kenrick Mock CS 470 Proposal
System Overview • Goal • Develop a system to graphically visualize properties of tidal basins • Client is Coastal Engineering • Why • Visualization will aid in the analysis of coastal erosion, effects of pollution, navigational access, and other aspects of waterways • To visualize the system today, Coastal Engineering uses a manual process of loading data into Excel
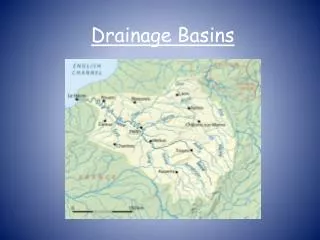
Data Files • Area of interest divided into 2D grid of cells. Five files containing source data. • Depth • Depth to basin floor, -99 to represent land • Elevation • Height of the water, indicates tide • U velocity • X velocity of water in a particular cell • V velocity • Y velocity of water in a particular cell • Concentration • Percentage of silt or other material in a particular cell
Data Source • Physical Model • Miniature version of the real thing • Computer Model • Fortran program • Most data in this project generated from a computer model
Data File Format • All files are in text • Depth file example • Mapping -99.00 -99.00 3.96 3.96 -99.00 3.96 3.96 3.96 -99.00 3.96 3.96 -99.0
Time-Based Files • Typically 2-5Mb in size • Value of each cell specified for a time period VERTICALLY AVERAGED BOD DAYS= 2.0833334E-02 HOURS= 0.5000000 -2.00 -2.00 1.00 1.00 -2.00 1.00 1.00 1.00 -2.00 1.00 1.00 -2.00 VERTICALLY AVERAGED BOD DAYS= 4.1666668E-02 HOURS= 1.000000 -2.00 -2.00 0.98 0.94 -2.00 0.98 0.95 0.93 -2.00 0.97 0.94 -2.00 VERTICALLY AVERAGED BOD DAYS= 4.1666668E-02 HOURS= 1.500000 -2.00 -2.00 0.94 0.92 -2.00 0.95 0.93 0.91 -2.00 0.94 0.87 -2.00
Visualization Using Excel • Import data, assign colors based on values • Slow! • Especially slow for time-based data • Solution: Program to automatically visualize data
Specifications • Dialog box to select data set • Graphical display corresponding to the data in the tidal basin • “Play” button to animate display for each time step • A “play” button should be placed on the application that begins animating the graphical display for each time step. • Concentration and Elevation should be displayed in different cell colors, with at least three levels of greyscale required and colors optional • Display quantity E, essentially the inverse of concentration • Velocity vector should be drawn in each cell specifying direction of velocity
Mock-up of Proposed Solution Will use prototyping to incrementally refine the system
System Specifications • Windows 2000 or XP • Visual Basic 6.0 • 256 Mb of memory, 450Mhz or higher • 1024 by 768 pixel resolution
System Design • For speed, load all data into memory • Depth file: 2D array • Time-based files: • Dictionary of 2D arrays • Simpler than a 3D array • Dictionary is like a dynamic, content-based vector
Addressing Flicker • Screen update while cells are being re-drawn for the next time step can result in unpleasant flicker • Use “Double Buffering” solution • Draw new cell colors on the hidden screen • Draw new vectors for velocities on the hidden screen • Copy entire hidden screen to the visible screen
Planning Estimated 156 hours total with incremental prototyping methodology: Requirements: 15.6 hours Design: 15.6 hours Implementation: 43.7 hours Testing: 49.9 hours Write-up: 15.6 hours Presentation: 15.6 hours
Conclusion • Goal is the delivery of a system to visualize tidal basins • Many challenges • Refining the design and specifications • Lack of formal specifications is expected to lead to future specifications and requirements • Prototyping methodology • Proposed solution • Utilize Visual Basic’s dictionary object, event processing, and easy UI design to construct a usable and powerful system